Celebration at Midori Haus: Millionth Square Meter of Passive House

February 1, 2015
Bjorn Kierluf presenting Millionth Square Meter of Passive House Award – photo by Claire Darling 

Date:  February 20, 2015

Time:  3:00 pm
Place:  Midori Haus 
Special Guests:  Bjorn Kierulf, Andrew Michler, Mayor Don Lane, Leslie Villegas (Senator Bill Monning’s staff)

In December 2014 Midori Haus received the official certificate for Passive House Certification from Passivhaus Institut in Germany, marking the milestone of millionth square meter of Passive House around the world.  See the international press release here.

What Is Passive House?

Passive House is a performance-based energy standard in construction. Results from buildings  constructed using the Passive House approach show 80% ~ 90% less energy is used to keep it comfortable.  This voluntary standard is internationally recognized and applies to all types of buildings, not just single family homes.

Why Is this Significant?

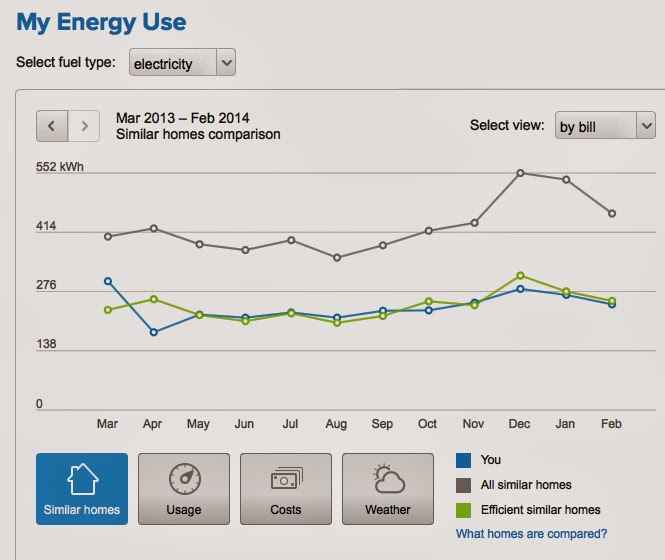
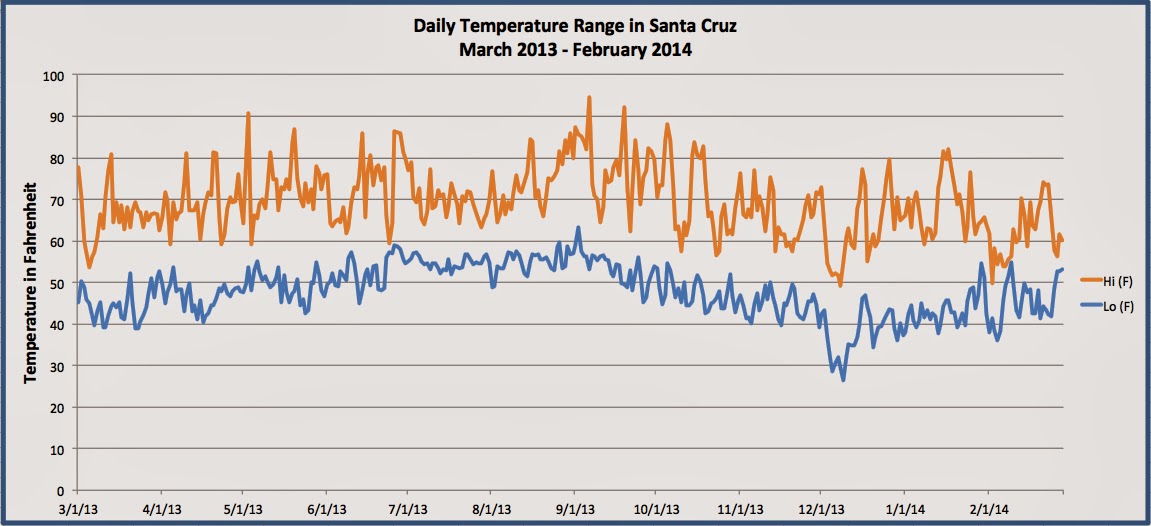
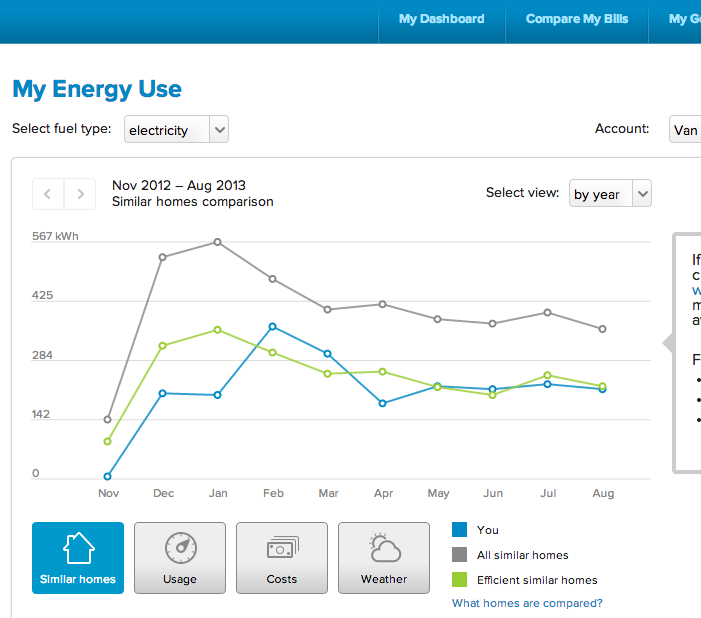
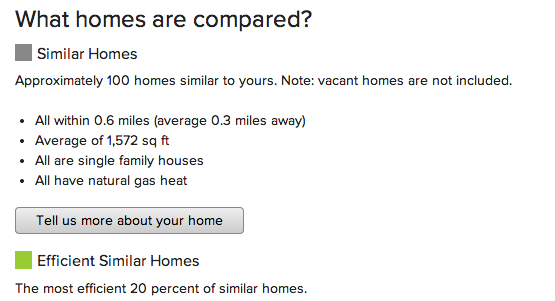
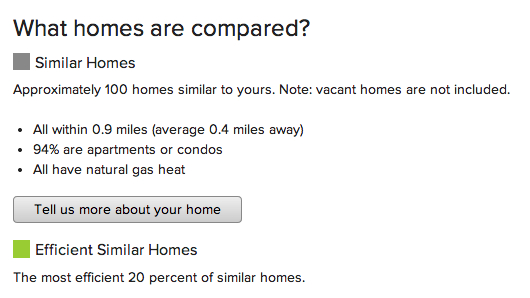
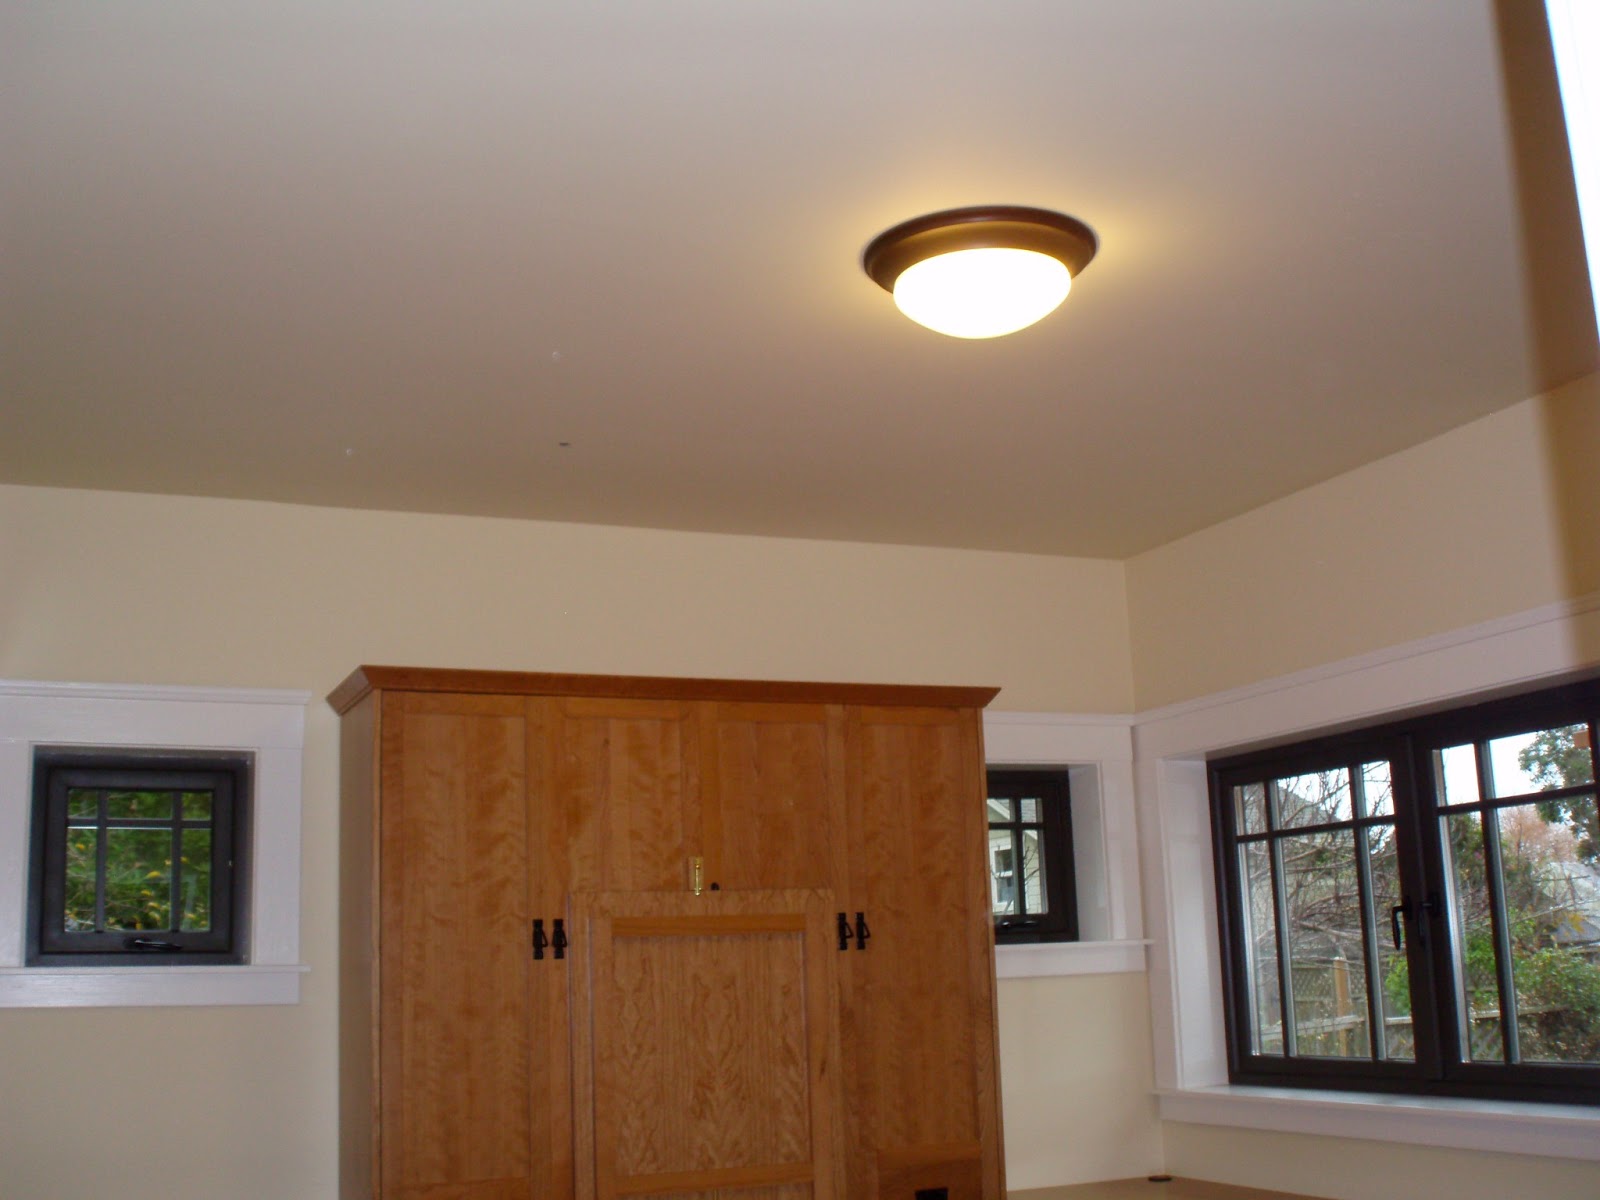
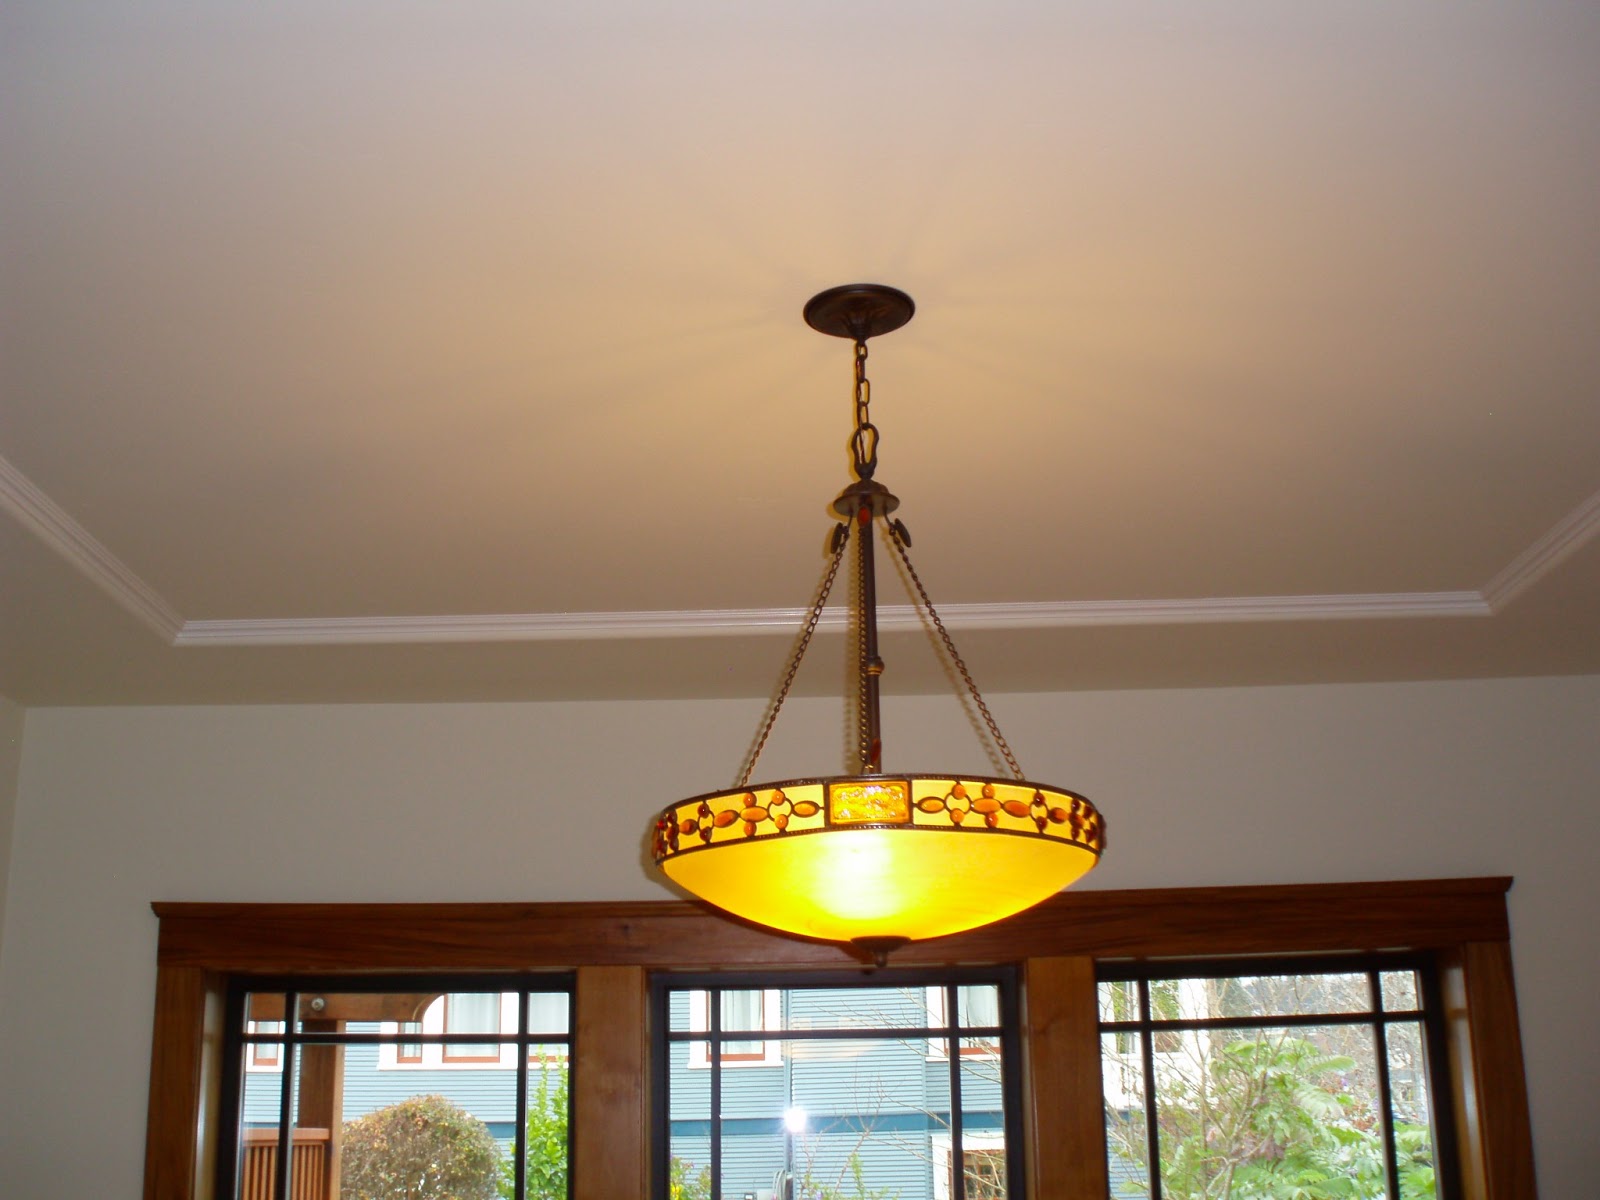
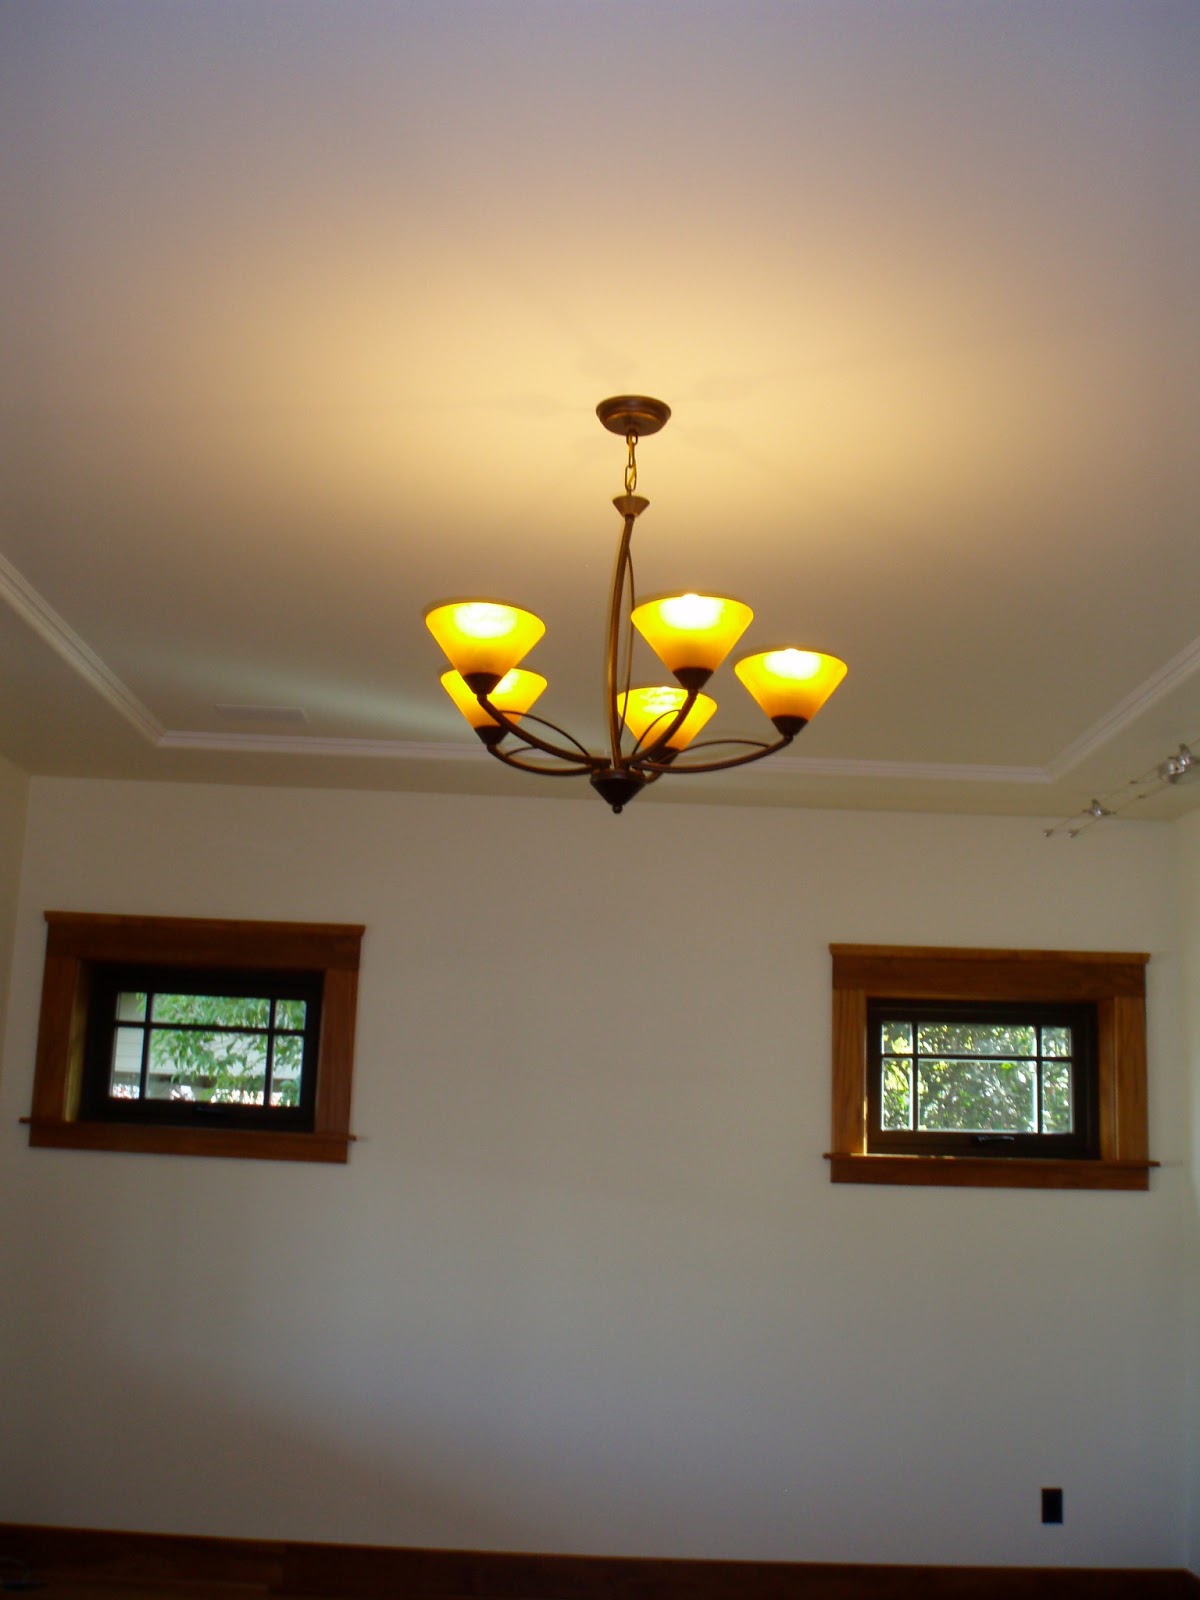
It’s a glimpse into the future of housing.  Midori Haus demonstrates that a 93-year old house can have extraordinary energy performance (80% reduction in energy compared to pre-remodel, without applying solar electric panels) and still retain the charm of the original Craftsman architecture.  Energy bills from PGE show that significant reduction of home energy use is possible for all seasons of the year.  Occupants enjoy comfortable temperature and good indoor air quality for the life of the building.  Building owners can do this today by following the Passive House Standard, which has over 20 year track record for reducing energy usage in a buildings.  

In his inaugural speech on January 5, 2015, California Governor, Jerry Brown unveiled ambitious energy goals:

“…we are well on our way to meeting our AB 32 goal of reducing carbon pollution and limiting the emissions of heat-trapping gases to 431 million tons by 2020. But now, it is time to establish our next set of objectives for 2030 and beyond.Toward that end, I propose three ambitious goals to be accomplished within the next 15 years:Increase from one-third to 50 percent our electricity derived from renewable sources;Reduce today’s petroleum use in cars and trucks by up to 50 percent;Double the efficiency of existing buildings and make heating fuels cleaner.”

Midori Haus shows that Passive House Standard easily lead the path towards the Governor’s goal of doubling the efficiency of existing buildings.

About Midori Haus

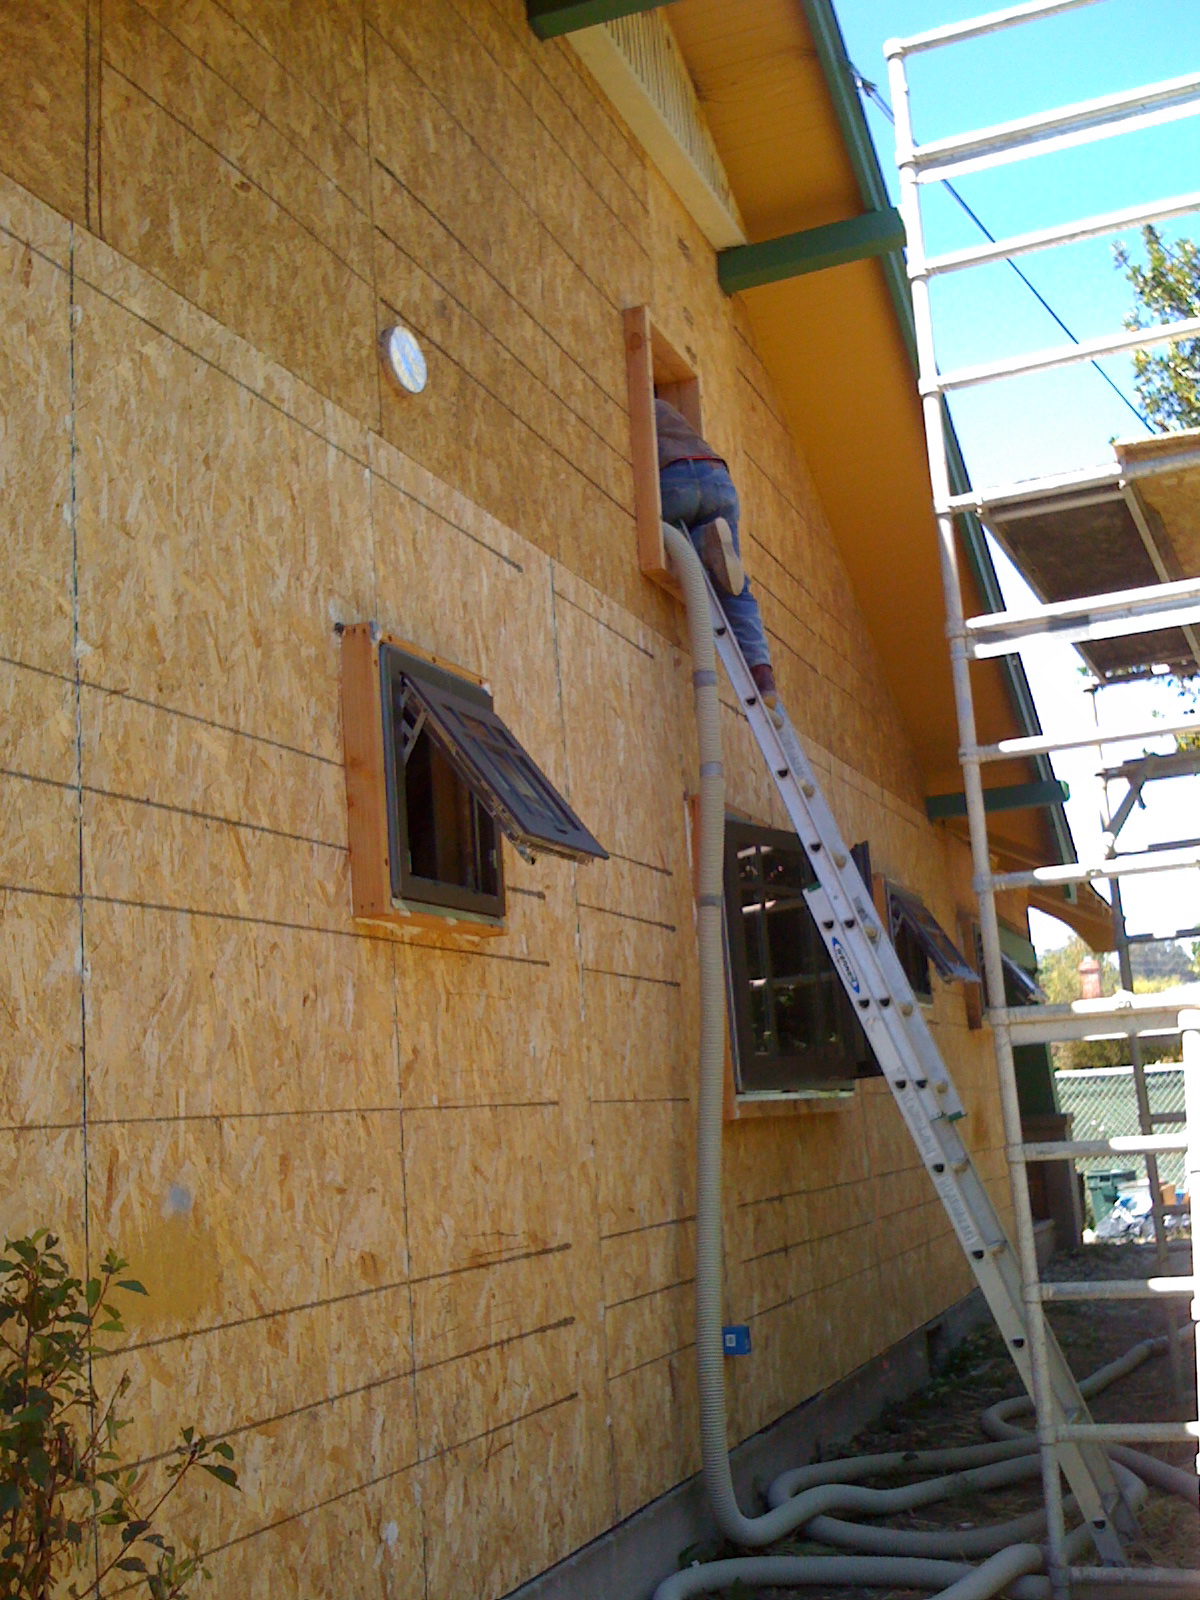
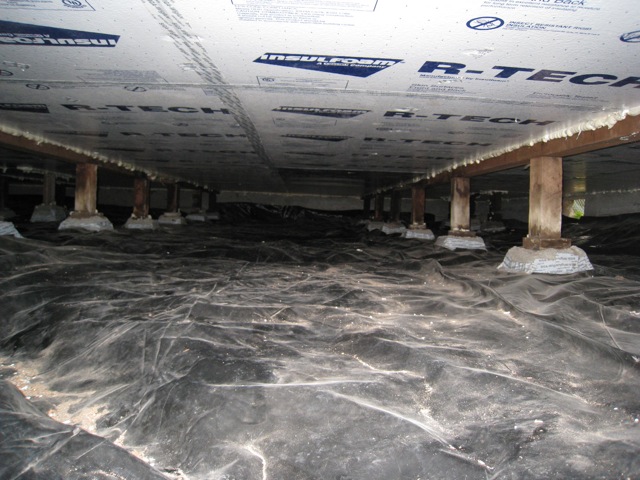
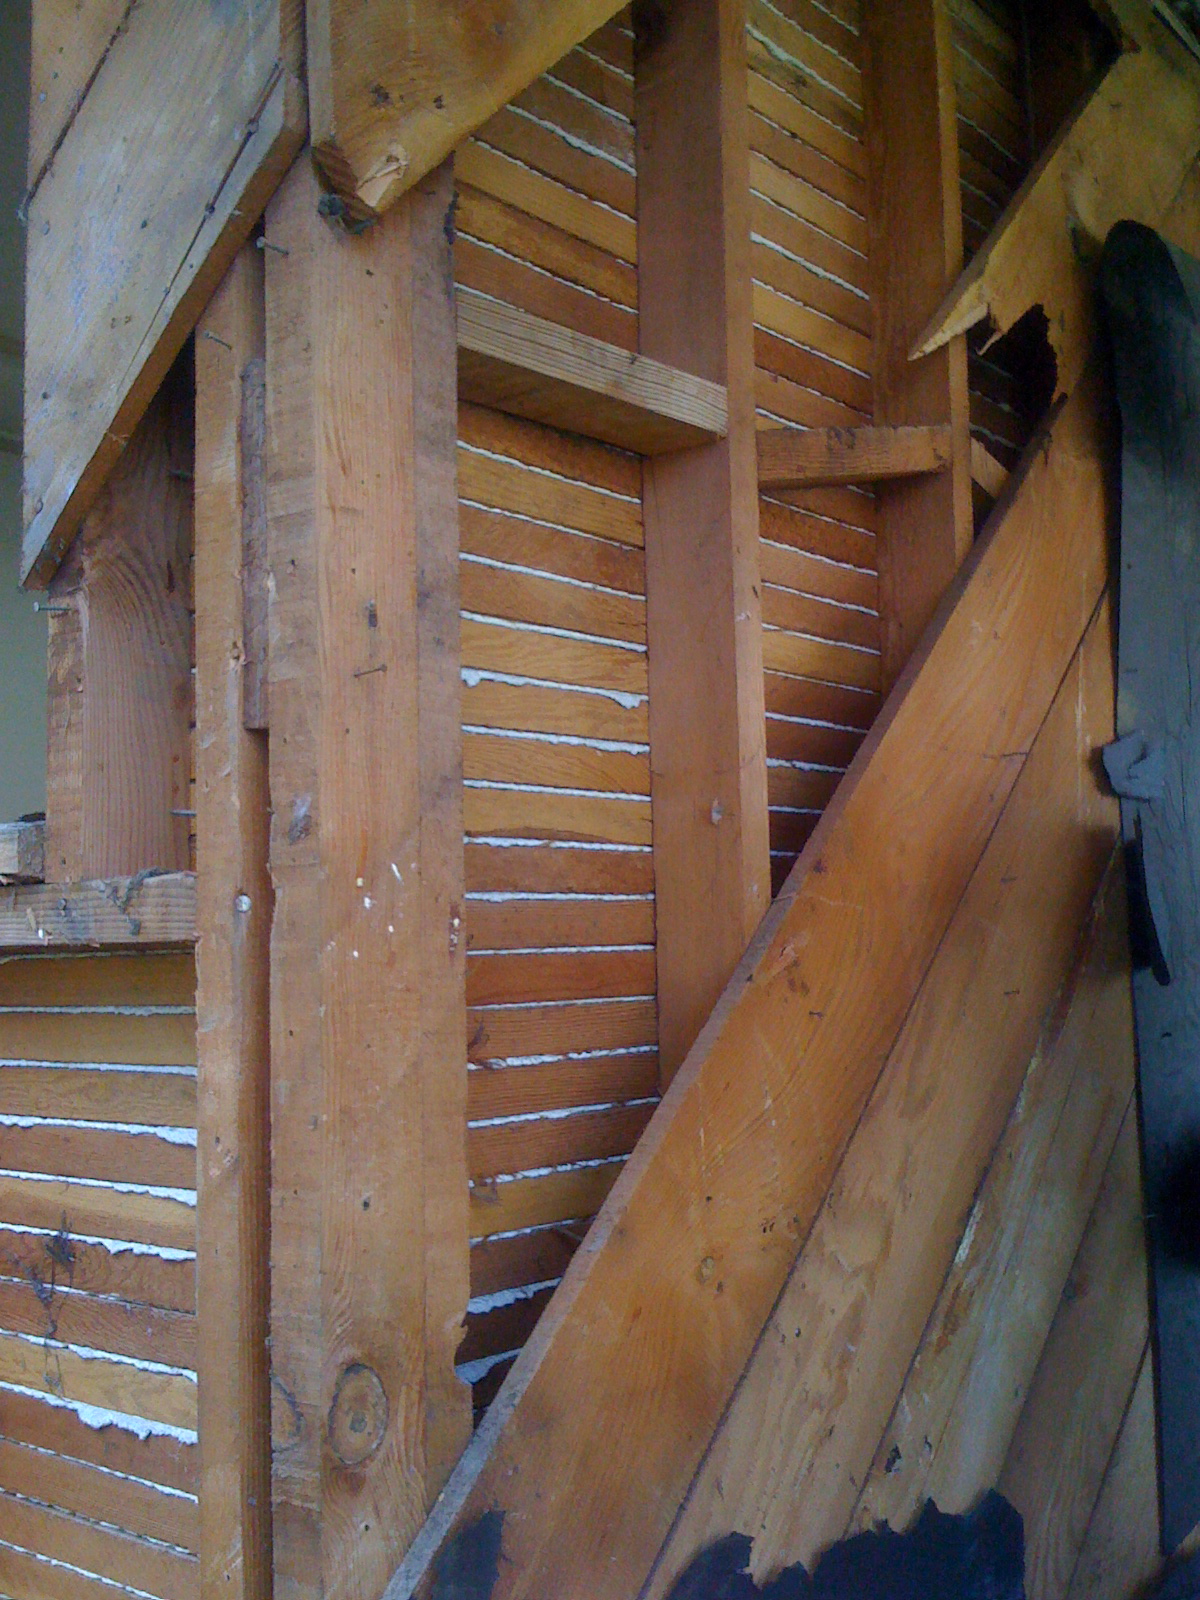
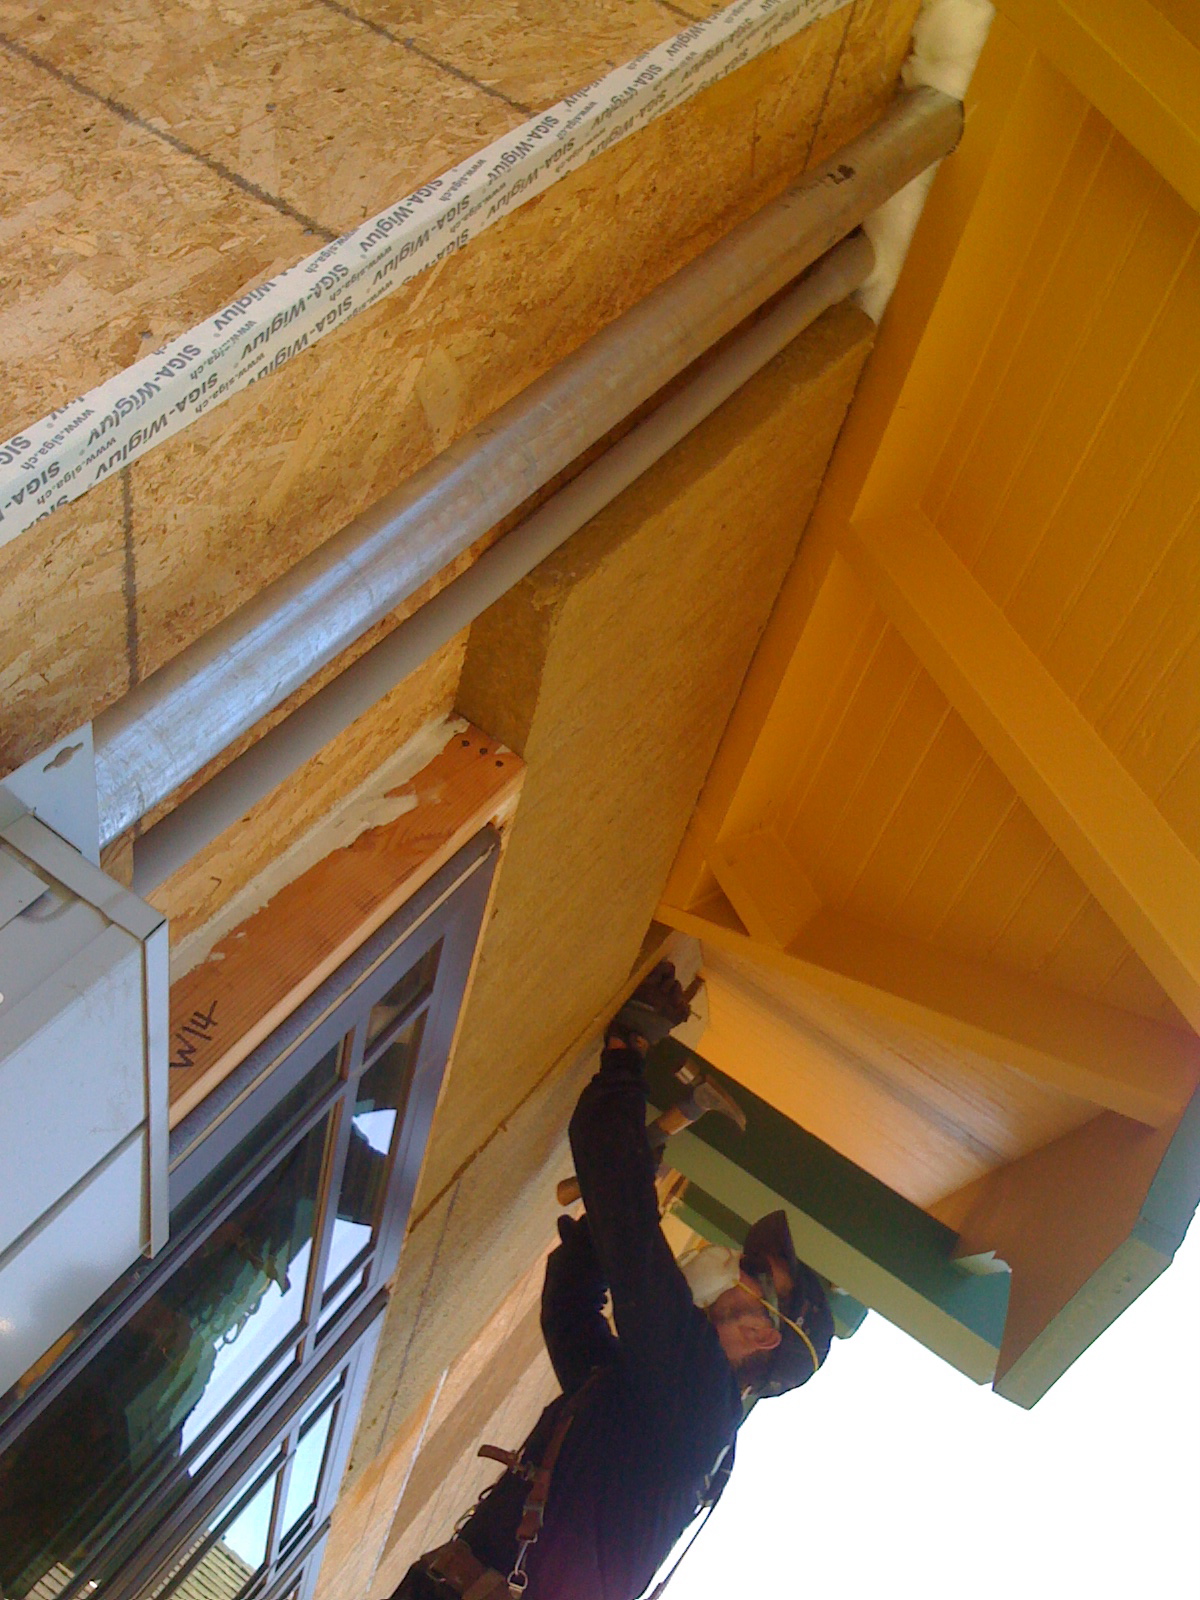
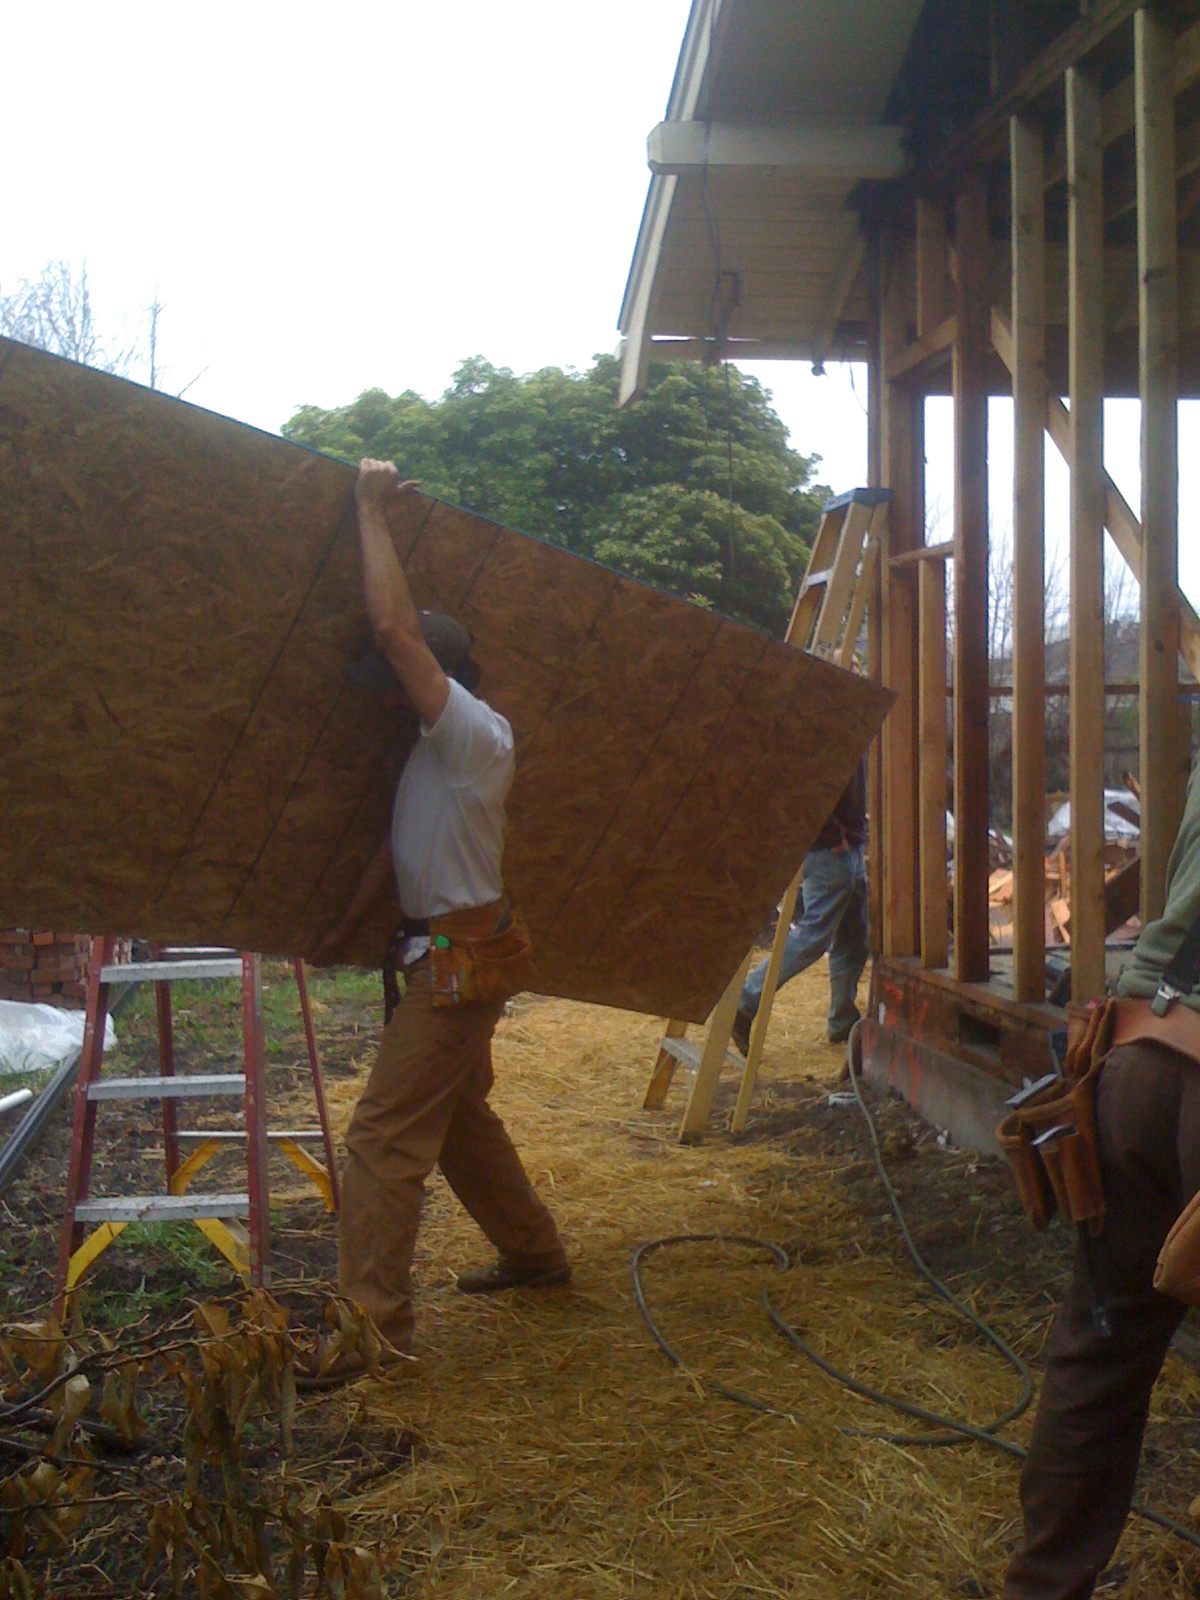
Originally built in 1922, the 3-bedroom, 2-bathroom single story house was remodeled in 2012 to the Passive House Standard.  The house retained the original foundation, floor, framing, porch, built-in furniture, as well as the interior trims and accents.  Utility bills from PG&E showed that the energy consumption did indeed drop by 80%.

Midori Haus – photo by Kurt Hurley

Design and Passive House Services:  Graham Irwin, Essential Habitat
Construction:  Taylor Darling, Santa Cruz Green Builders

Please refer to the following post for details on energy and water.
Energy Usage:  How Much Energy Did We Use In Our First Year?
Water Usage:  Water Efficiency Features

Contact:  [email protected]

Don Lane, Mayor of City of Santa Cruz, shares his observation of Midori Haus transformation – photo by Bronwyn Barry

Leslie Villegas from Senator Bill Monning’s office presenting Certificate of Recognition from California Senate
– photo by Bronwyn Barry
Taylor Darling, General Contractor, and Graham Irwin, Architect and Passive House Consultant – photo by Claire Darling

Midori Haus Team:  Taylor Darling, Graham Irwin, Tom Nedelsky, Pat Splitt, Chie Kawahara, Kurt Hurley
– photo by Bronwyn Barry

How Much Energy Did We Use In Our First Year?

About one year ago I cut off 30-inches of my hair
and donated the half-pound of hair to Locks of Love, an
organization that makes wigs for children.  I’ve done this a few times
before and it makes me feel good.  In the past friends would often ask me,
“How’s your house project coming along?” and at times it seemed to go
on forever.  So at one point I started telling everyone, “You’ll know
when it’s done because I’ll cut off my hair and donate them.  If you see
me with short hair that means the house is done!”  So I was quite
happy when I had this photo taken because it meant the house was done and I
didn’t need the extra insulation to keep me warm.
Now that we’ve been living in Midori Haus for one
year it’s time we share our energy data for the first year of occupancy.
 You might recall from my previous post where we compared our energy
data for the first 8 months in Midori Haus with the energy data from the
slightly smaller condo we used to live in.  We were pleased with the
comparison of spring-summer data where our total energy use at Midori Haus
proved to be much lower than the smaller condo.  Now that we have the
energy data for the winter season it’s even better.   Let me show you some
graphs.

If you are a PG&E customer, the above graphs
will be familiar to you.  You can log into your account at pge.com and
select the “My Usage” tab to track, compare, and monitor your energy
usage.  They do a nice job of comparing your energy usage with similar
homes in the area.  Similar homes in the context of Midori Haus is 100
homes with similar square footage (1560 in our case) within half-mile radius
that are heated by natural gas.  At Midori Haus we let the sun do the
warming most of the time but when the sun is not shining the gas boiler
provides make-up heat for the hot water tank and the hot water warms the house.
 Since there is not a category for “mostly sun-heated house” we
technically fall into the category of “heated by natural gas.”

In this past year (March 1, 2013 through February
28, 2014) we used a lot less energy than similar homes.  The total energy
use at Midori Haus was 4,334 kWh
compared to 19,596 kWh for similar homes.  Our Midori Haus used 2,869 kWh
of electricity and a scant 50 therms (this is equivalent to 1,465 kWh) of
natural gas while similar homes used 5,118 kWh of electricity and 494 therms
(this is equivalent to 14,478 kWh) of natural gas.  To put it in another
way, Midori Haus used only 22% of the total energy used by similar homes in the
past year. 

By the way, we were comfortable inside and we do
not have PV (solar electric) to offset our electricity usage.  We plan to
do so in the future but it was important for us to start from the most
efficient house before we put in PV.
This next graph is very validating.  We’re
fortunate to have copies of the energy bills from the prior owner of the house.
 The seller was friendly and ordered PG&E to send copies of the past
energy bill to us for the years 200 and 2006.  Back then there were 3 elderly
occupants in the house and they used gas furnace to heat the house and perhaps some electric space heating too.  Their energy bill from March
2005 through February 2006 is a good basis of comparison with our first year of
post-retrofit occupancy at Midori Haus because many things about the house is
the same:  same square footage, same foundation, mostly same framing, same
floor, same roof, and we kept the original built-in-furniture (dining room
buffet) in place.  So the reduction in energy use that you see below represents
the performance of the house before (without any insulation or air sealing) and
after (super-insulation, extreme airtightness, minimizing thermal bridges, heat
recovery ventilator, low energy lighting, and low energy appliances).  

The prior occupant used 21,928 kWh of energy in one
year.  Midori Haus used 4,334 kWh of energy in one year.  That is
80% reduction in energy use for the same house!
 And Midori Haus stays
in a comfortable temperature range year round with good indoor air quality.
 Passive House works!

Digging further into gas usage I wanted to see if
there is a correlation between rain and gas usage.  So I overlaid the our
daily natural gas usage with rainfall.  It’s a bit challenging to see the
details but you’ll notice that the when there is rain (blue column) the natural
gas (red column) follows close by.  This confirms that gas boiler turns on
if the sun is not shining.  The little blips of gas you see in the summer
months represents outdoor barbecue use.  We have natural gas plumbed to
the barbecue on the deck.
The source of rain data is from a local weather
station that I found on the weather underground site.  The Weather Cat station
is located just 2 miles away from Midori Haus so it’s a good representative of
the outdoor condition for the past year.  Below is a graph of the daily
high and low temperature.  What you will see below is that there is always
about 10-30 degrees Fahrenheit temperature difference between the daily high
and daily low.  Because of this diurnal swing in the temperature we don’t
need to have air conditioning during the summer because the house will cool off
at night if we simply open the windows for an hour or so.  

I now present to you a simple conclusion:  Passive house works.  Up until now we’ve been telling everyone, “Once we have a house built to Passivhaus standard we will use 80% less
energy than similar homes.”  Now we can actually show the data where
we have used 80% less energy than similar homes.  Don’t you want your home to be
passive house too?  :)

Energy Usage: First 8 Months

September 1, 2013

Are you curious how much energy Midori Haus uses and how it compares with other houses in the area?  The proof is in the utility bill.  When I get the utility bill from Pacific Gas & Electric (PG&E) each month via email I always log in to their site to look at the “My Usage” tab to see how our electricity and natural gas usage compare with similar homes in the area.  Take a look at these screen shots:

Our electriity usage averaged 227kWh per month for the last 6 months (Mar-Aug).  You can see from the graph that our usage (blue line) is pretty low, tracking closely to the efficient homes (green line) in the area.  The house was in construction through January and we started living full time in the house on March 15, 2013 when the blinds for the windows were installed.

Electricity usage was a bit higher in February and March when we had several fans and vaporizers running 24/7 to remove the smell coming from the stains applied to the fiberglass door.  Usage was low in April when we were on vacation for 10 days.

 Our natural gas usage averaged 1.8 Therms per month for the last 6 months (Mar-Aug).  Our gas usage (blue line) is just a fraction of similar homes in the area and even lower than the most efficient homes in the area.

We use a gas boiler as a backup heat source for domestic hot water.  Primary source of heat for the hot water is the sun.  We have a solar thermal system (to be explained in a separate post) that pre-heats the hot water.  We also have a natural gas barbecue grill out on the deck.  That accounts for the little blip in gas usage in the summer — 2 Therms in June, 1 Therm in August.

You may wonder what homes are compared in these graphs.  PG&E does a good job of giving us an apples-to-apples comparison.  The definition of similar homes for us is single family houses with an average of 1572 sq ft using natural gas heat within 0.6 miles.

Our house is technically heated by gas because PG&E does not have a category for homes heated by the sun.  How is our house heated?  When the temperature in the hallway thermostat dips below 68F a pump in the mechanical room turns on to circulate hot water (mostly heated by the sun) through the hydronic coil in the house.  The hydronic coil is used to warm up the air in our ventilation system. For a typical house this amount of heat is not enough to make it comfortable.  But Midori Haus is a passive house that is super-insulated and super-airtight.  So we only need the equivalent energy of half a hairdryer to heat our home in the winter.  Should the temperature in the hot water tank dip below 120F then the backup gas boiler turns on, thus the house is technicall heated by natural gas.  But as you can see from the graph above this doesn’t happen regularly.  The higher usage of natural gas in January and February reflects the start-up condition for the hot water heater.  The storage tank and the backup gas boiler were installed and turned on in January when it was cold outside and the sunlight duration short.  So the gas boiler did bulk of the work to heat up 165 gallons of water to 120F.  It’s amazing that we only used only about quarter of natural gas that similar homes used in January and the house was comfortable.

The amount of energy reflected in the utility bill is not only for heating the house.  A good portion is attributed to appliance choices and our behavior.  At Midori Haus we use electricity for cooking, clothes washing, lighting and handful of gadgets plugged into the wall.  When we lived in the 1300 sq ft condo we had lots of gas appliances — wall furnace, standard hotwater heater, stove and oven.  So I expected our electricity usage to be a bit higher at Midori Haus than at our condo.  And it is a bit higher but not by much.  To compare the energy usage between similar seasons I grabbed a few screen shots of the energy usage at our condo in 2012:

 The monthly electricity usage averaged about 147 kWh for the condo for the same period last year (Mar – Aug 2012). Some of the gadgets consuming electricity are the same — laptop computers, stereo, hair dryer, coffee grinder, etc.  The occupant behavior is somewhat similar too.  The difference in occupant behavior is that I spend far less time at Internet cafes now.  Back in 2012 when I was uncomfortable at the condo (I thought it wasn’t warm enough) I packed up my computer and hung out at the local coffee shops.  Now I don’t do that.

 The gas usage at our condo has an interesting story.  In the winter of 2011-2012 we did an experiment of setting the thermostat for our wall furnace really low and wore layers of sweaters to keep warm.  In our mild climate in Santa Cruz if you set your thermostat at 55F in the winter it hardly turns on.  I thought our gas usage would be pretty flat to track with the summer usage pattern.  But it didn’t.  It was lower than similar homes and the curve rather bumpy. The winter usage went up as if we were turning on the wall furnace but we did not.  Our gas usage (blue line) was even higher than efficient similar homes.  What’s going on?  The likely culprit is the water heater.  The gas water heater at the condo was located in a cabinet next to the refrigerator in the kitchen.  It’s in the conditioned space so it had no insulation around the water heater.  This is OK for most times when the kitchen temperature is between 68F and 72F, but not when the kitchen temperature is at 58F.  So the water heater was using more gas in the heater to keep the water warm.  Interesting, isn’t?

 The similar homes for the condo are all apartments or condos with natural gas heat located within 0.9 miles.  Our condo shared 2 walls with our neighbors so 50% of the walls are well-insulated.  But it is definitely not airtight and I was often cold in the winter.  People in cooler climate may laugh when I complain about it being cold in the winter here but I grew up in Hawaii where it’s nice and warm.

It’s hard to compare the energy bills of homes with different types of appliances (e.g. gas stove top vs. induction cooktop, gas clothes dryer vs. electric condensing clothes dryer, gas wall furnace vs. hydronic coil).  To do an apples-to-apples comparison I took the 6 months data (Mar – Aug 2013) for Midori Haus and the 6 months data for the condo (Mar – Aug 2012) and converted the gas usage (measured in Therms) to equivalent electricity usage (measured in kWh).  1 Therm is equivalent to 29.307 kWh.  Plotting this combined usage data on a graph I found the Midori Haus total energy usage to be much less than the total energy we used at the condo.  It’s the same people with same occupant behavior but  living in a different space.  This means the dwelling itself is much more energy efficient and the space is much more comfortable.  Passive house is amazing.

Lighting

February 28, 2013

According to U.S. Energy Information Administration (EIA) estimate 461 billion kilowatt-hours were used for lighting by the residential and commercial sectors in 2011.  This is about 17% of the total electricity consumed by both of these sectors and 12% of total U.S. electricity consumption.  This government website contain interesting data.  For example, looking through some of the tables on this site I noticed that 1995 was the year when electricity use by the residential sector exceeded the electricity use by the industrial sector.  But I digress.  This post is not about historical electricity consumption data but about lighting choices we’ve made at Midorihaus.  For those who want to explore the rabbit warren of historical energy data I invite you to look at this report from EIA.

We wanted 3 outcomes for lighting at Midorihaus: (1) good light quality that is functional and pleasing, (2) energy efficient performance of the materials, and (3) aesthetics of the lighting fixtures to match the overall Arts and Crafts style of the Bungalow architecture.  These 3 outcomes were equally important so naturally Kurt drove this area.  Not only does he have the gift of easily juggling and synthesizing different aspects and ideas all at once he also has over 2 decades of analog photography experience which trained his eyes to notice different qualities of light plus the science background to tie it all together.

The Arts and Crafts aesthetics part was fun.  Looking at books on Arts and Crafts style and visiting lighting stores to look at fixtures were enjoyable.  Our neighbor turned us on to The Bright Spot website and we were delighted to find reasonably priced Arts and Crafts style lighting fixtures.   We bought most of our lighting fixtures from The Bright Spot.

Researching and buying the light bulbs took a bit more time.  The light quality and energy efficiency aspects were challenging because evaluating light quality is subjective and the technology, especially with LEDs, is changing rapidly.  We’ve heard leaders in this field talk about how in 2 years the LEDs will be much better performing at lower cost than it is today.  But we can’t wait 2 years — we need to put some kind of lighting into the house now.  So, here are the steps we took to figure out what light bulbs to use:  1) Visited lighting retail shops to check out what they had in stock and compared them on their display board with dimmers; 2) Bought a number of CFLs and LEDs that looked good at the store; 3) Put the sample light bulbs in the fixtures in different rooms to note what we liked and didn’t like; 4) Measure actual performance of the light bulb (rather than trust the printed stuff on the box).

1) Visiting lighting retail shops.  We started locally at Riverside Lighting & Electric in Santa Cruz.  After identifying few different types of Compact Flourescent Lamp (CFL) and Light Emitting Diode (LED) bulbs we asked the salesperson if we could use the display board with a dimmer to see the lights side by side.  By putting different things near the light, such as your hand or paper with color, you can judge with your eyes what looks pleasing to you.  Since we specified dimming switches in several of the rooms it was important to have a bulb that performed well in dimming function.  Some of the bulbs had a noticeable color changes or reduced sensitivity when dimmed.  Other shops we visited were City Lights in San Francisco,  Bay Lighting Supply in Santa Clara, Light Point in Menlo Park, and Rejuvenation in Berekely.  City Lights in San Francisco had a wide selection of light bulbs and separate departments and staff for lighting fixtures and light bulbs.

2) Buying CFLs and LEDs to try at home.  We bought the CFLs and LEDs below to try out in the fixtures in our home.

CFL Bulbs:  GE, TCP 850 lumens, TCP 750 lumens

LED Bulbs:  Green Creative, Energetics, Philips, LEDwiser

3) Try the light bulbs in the lighting fixtures.  Seeing the bare bulb in the lighting store is nothing like seeing the bulb in the fixtures in the actual room in the house.  It was amazing to see how many different things can affect the overall light quality — the paint colors of the wall and ceiling, the direction the lighting fixture, the type of material used in the lighting fixture (colored glass, metal borders, etc.), furniture in the room, and time of day.  We found that while the labels on the boxes (color temperature, lumens, watts) contain information that will guide you on narrowing down the initial selection, the actual “feel of the light” in the rooms determines the best fit.

Below are some pictures of our lighting fixtures in various rooms.

Office & Guest Room:  Kenroy 806362ORB Builders Modern Mission Builders Modern Mission Ceiling Light 3 Lamp with LEDwiser bulbs.
Office:  Kichler 70598 Zen Table Lamp with Philips bulbs.

Kitchen Breakfast Bar:  Kichler 65292 Joya Mini Pendant with Philips bulb.

Dining Room:  Kichler 65290 Joya Chandelier with LEDwiser bulbs.

Living Room:  ELK Lighting 7647-5 Elysburg 5 Light Chandelier with LEDwiser bulbs. 

 
Deck:  Kichler 9031DCO Morris Longbody Outdoor Lantern with LEDwiser 

Porch:  Kichler 9838DCO with LEDwiser

Bedroom:  Sconce with Green Creative bulbs.

You may have noticed that we used quite a bit of LEDwiser bulbs.  Kurt met the entrepreneur behind this up and coming company in San Jose through Cleantech Open and we were impressed with their product.  LEDwiser’s product had the best lumens/watt ratio and had good directional coverage.

4) Measure actual performance.  We used the Kill A Watt to measure the watts drawn by the light bulb.  This was an interesting exercise to see if the actual electricity consumption measured on this device is what’s advertised on the box.  We plugged in the Kill A Watt into the electrical outlet on the wall then plugged in a table lamp to the Kill A Watt.  Then different light bulbs were screwed into the lamp to measure their electricity consumption.  We found that all of the LEDs we tested measured below the watts advertised on their boxes.  The TruDim CFL from TCP had the characteristic of shooting above the advertised wattage when warming up then settled near the advertised number.

Performs as advertised
Overshoots while warming up

If you’re interested you can check out the summary of our test.  Once we decided which bulbs we liked we totaled up the numbers and placed orders with the respective companies.

…And then there’s Title 24

One area where we felt “handcuffed” in our lighting fixture selection was the kitchen.  Lighting in kitchen is subject to energy efficiency standards specified in California Code of Regulations, commonly known as Title 24.  Instead of using the Arts and Crafts style ceiling mount fixtures with LED bulbs we had to get a very specific kind of lighting fixture that forced you to using a specific type of high efficiency lighting.  Perhaps this code was meant to prevent homeowners from using 100 watt incandescent light bulbs all over the kitchen. The intention is good but it makes it harder for those of us who want to have better energy efficiency than code minimum.  Because this is part of the code where building inspectors check and there are limited number of manufacturers and models we had little choice.

If you’re curious about what Title 24 details take a look at this website, Title 24 Express, which seems to have the layman’s explanation of Title 24 in an easy to read layout.

If you are really into government regulations and want to read more about Title 24 then enjoy this government site.

Insulation

October 2, 2012

We want to be comfortable in the house.  There is a narrow band of temperature and humidity range we human beings are comfortable at.  The temperature-humidity chart below show the comfort zone to be in the low 70’s to 80 degrees Fahrenheit, which is about the ambient temperature in Hawaii.  Since less than 1% of the population of the U.S.A. live in the 50th State most of us encounter climates where the outdoor temperature is either too warm or too cold.

So to keep the inside of the house comfortable the shell of the house would need to slow down the transfer of heat between inside of the house and outside of the house.  This (either keeping the interior cool when it’s blazing hot outside or keeping the interior warm when it’s frigid outside) is what insulation does.  What type of material to use for insulation and how much to use depends on where you live and the goal you’re trying to achieve (performance and cost).

US EPA’s Energy Star site has this insulation map and accompanying table that shows different climate zones and the recommended level of insulation.  You’ll notice numbers preceded by “R” on the table such as R30, R25, R60, etc.  The R-value is the unit of measure for resistance to heat flow.  The higher the R-value the less heat flows between the inside and outside of the house. Different materials performance as insulators and you can find a table of R-value for different materials in this Wikipedia article.

Rather than use a generic table of recommended R-values we had our Passive House consultant and designer, Graham Irwin, perform the analysis and calculation using the Passive House Planning Package (PHPP) from Passive House Institute.  When all the details of the house (climate data for our zip code, house orientation, materials used etc.) are entered into the PHPP software it will calculate the amount of energy needed to heat and cool the house.  We have specific energy target we want to achieve for heating the house to meet passive house standard: 15 kWh/square-meter/year or 4.75 kBTU/square-foot/year. The same target exists for cooling demand for the year but since we live in a temperate climate that doesn’t require air conditioning it’s not a big concern for us.

Using the insulation specifications below our heating demand for the year to keep the house at comfortable temperature of 68-degrees Fahrenheit (20-degrees Celsius) is 8.75 kWh/square-meter/year.

Attic – 12-inches of blown-in cellulose; foam was applied to the tight corners along the wall-roof line (~R35)

Floor – 5.5-inches of fiberglass batts in the floor joist cavities and 2-inches of expanded polystyrene (EPS) board under that. (~R26)

Walls – 3.5-inches of dense pack cellulose (wet spray) in stud bays and 3.25-inches of rigid mineral wool (Roxul TopRock DD) on the exterior wall (~R28)

We had many discussions with the insulation experts, contractors, energy efficiency specialists and architects before deciding on the materials we chose.  One key learning for us was when we heard Alex Wilson speak at PG&E’s Pacific Energy Center in San Francisco.  He shared a story of a well-intentioned homeowner wanting to save energy and reduce greenhouse gas emission was horrified to learn that the spray foam product he used to insulate his house would take 60-years to payback — this is not financial payback but the time it would take his energy savings to offset the amount of greenhouse gas released into the air from the blowing agent used for his spray foam product.  So we decided to stay away from spray foam products.  You can find one of Alex Wilson’s article on insulation at Green Building Advisor.  The chart below is from that article.

Attic

Here are some before and after picture of our attic.

Before:  Very little insulation in the attic

You can see from this “before photo” that we did have some attic insulation, if only to barely cover the ceiling joist.

After:  over 12 inches of blown in cellulose

In this “after photo” you can see the measuring tag sticking up from the sea of cellulose to indicate that between 12 and 14 inches of cellulose filled  the space.

The insulation sub-contractor, Ponzini Insulation, did the cellulose insulation in the attic and in the wall cavity.  Applying blown in cellulose in the attic.  They had a big truck with special attachments to pump the cellulose through the long hose to apply the insulation.

Insulation Truck

Installer applying blown in cellulose into the attic

Floor

Crew from Santa Cruz Green Builders did the insulation and air sealing below the floor in this cozy crawlspace.  Fiberglass batts filled the 5.5-inch deep cavity between the floor joists.  Then sheets of 2-inch thick EPS board was applied under that.  The seams of the EPS boards were meticulously taped using Siga tapes.  Because the EPS board serves dual purpose of insulation and air barrier the edges of the board coming in contact with other material (wood, concrete) were foamed to prevent air leakage.

Crawl space view of the floor after completion of insulation 

Walls

Our 90-year old house did not have any wall insulation!

Before:  No insulation between stud bays

As you can see from this deconstruction photo, the space between the exterior skip sheathing (horizontal board) and the interior wall made of lath (small strips of wood) and plaster was empty.

After:  wet spray cellulose filled the wall stud bays

Wet spray insulation was applied to the open stud bays in the interior wall cavity.  This took almost one week to dry fully but it allows for visual inspection of cellulose application.  Speaking of inspection, we had Quality Insulation Inspection (QII) performed by Bright Green Strategies for the California Advanced Homes rebate program.

Mineral wool material applied to exterior sheathing

Sheets of rigid mineral wool were applied to the exterior wall.

We used TopRock DD from Roxul

Beginning of Air Sealing

Why Air Sealing?

We want our house to be comfortable, durable and energy efficient.  So air sealing is an important element in meeting those criteria.  You know that air can pass through small cracks, spaces and even pin holes, right?  For example, if you see daylight in the door frame when it’s closed you’ll feel a draft standing next to it when it’s cold outside and warm inside.  Then if you put weather stripping around it to prevent air flow the house feels more comfortable, right?  So, stopping air leakage leads to comfort.

Air sealing also leads to durability of the building because air can transport moisture.  You might ask, what’s the connection to durability?  Well, remember the pictures of rotted skip sheathing due to rain water intrusion?  Prolonged water exposure can cause wood to weaken and also invite mold to grow.  Not good for durability of the structure nor the health of occupants.  Let’s imagine a hypothetical example for illustrating why moist air passing through cracks in the walls is bad for durability.   Say there’s a lot of cooking going on in the kitchen and the indoor temperature is 80 degrees with 50% humidity and the outside temperature is 40 degrees.  The dew point (the temperature that vapor in the air changes to liquid) is 59 degrees.  Warm air can hold more moisture than cold air.  So for a given relative humidity, the the surrounding air temperature will determine if it will stay in the air as moisture or condense to liquid and become water.  For an explanation of using simplified psychrometric chart have a look at this guide on air properties from NebGuide.  In this hypothetical example the warm air leaking through the kitchen wall will to the outside will encounter drop in temperature along its path and when the temperature drops below dew point the moisture vapor will change to liquid water.  If the cold surface happens to be the insulation layer it will get soggy and dampen the wood around it and if it doesn’t dry out over a period of time there will be rot and maybe mold.  So, stopping air leakage leads to durability.

Air sealing is good for energy efficiency.  Imagine driving in your car with the windows open in the winter.  The heater is on in the car but the hot air is escaping through the window.  When you close the window it’s warmer because the heat is no longer escaping through the window and you can use a lower temperature setting to stay comfortable.  Same thing with the house.  If you have the windows open you use more energy to heat the house than if you had the windows closed.  The opening and closing of the windows are something we can do voluntarily to control and minimize the use of energy to heat the house.  The air sealing of small cracks and spaces are like having lots of tiny miniscule windows that we can’t close.  Some of these cracks are buried under layers of building material and homeowners can’t get to them easily.  So we rely on the builders to ensure that these miniscule uncontrollable windows in the house at different stages of construction.

Air Sealing Examples

When we’re talking about air sealing for passive house standard the builder is taking steps to mitigate air leaks from tiny spaces like gaps between two pieces of wood on a top plate, mudsill, etc.  To refresh your memory, we are striving towards Passivhaus certification and the airtightness goal is 0.6 air changes per hour (ACH) at 50 pascals.  If you recall our baseline blower door test came in at 22 ACH.  This means we are targeting the house to be 3600% more airtight than the original house!

By the way, you may want to take a look at this page for a brief overview of Passivhaus.

Air sealing work on the wall framing was done prior to sheathing.  These guys examined the places were unintended airflow could occur, like the junction of mudsill and studs, corners, etc.  Below are some pictures of air sealing examples.

To prevent air leakage in the small pinhole openings the crew shot foam
into the openings, sometimes drilling through the stud to access a spot where
the foam could expand and fill all the crevices, then sealing the outside with
a tape.  The crew tended to this
tedious work diligently towards the goal of 0.6 air change per hour at 50
pascals.  
Here are some examples of air-sealed spots where foam was blown in and covered up with tape.
Sealant from Perma Chink was applied with a bulk loading gun to ensure sealing of the sheathing to the wall studs.

Midorihaus Passive House Windows

It’s important readers! High performance windows tuned to the climate and the compass orientations of the building envelope area are a critical part of the Passive House architectural approach. In our case the glazing area comprises [290ft2/ 1700ft2] or about 17% of the total wall area. The holy grail of window thermal performance is R factor, which is a measure of heat resistance related to the heat transfer per unit area per degree temperature difference from interior and exterior. In the US it has units of (ft²·°F·h)/Btu and is known as R-value. In the rest of the world, window performance is quantified in metric units by a measure of thermal transfer efficiency known as U-factor which is inversely proportional to R-value and whose units are W/(m²·°K). You can see the impact of windows’ thermal performance (R-value) on the overall wall assembly as a function of % glazing area from this graph:
The process of choosing our Passive House windows was quite involved. We were not only trying to achieve the best cost-performance from the window itself but were also wishing to improve the Bungalow aesthetic of our home by adding simulated divided lites (SDLs) known in the past as “muntins.” The original 1920’s architect employed single pane windows throughout the house without muntins. Divided lites are however a key stylistic hallmark of the Bungalow. The opportunity to add this important Bungalow stylistic feature made removing the old single pane lead crystal less regrettable.
Throughout our project we wanted to source materials as locally as possible. However the very best performing windows are European. This also means they have a huge embedded energy resulting from the considerably long shipping distance. High quality European triple glazed windows are generally fabricated from timber sustainably forested in the EU. Wood windows may have as little as 1/6 the embodied energy compared to fiberglass windows and 1/10 the embodied energy compared to vinyl windows. However even with this high performance their total life cycle back time would be largely compromised in the short term because of the embodied freight energy.
Lower cost domestic vinyl windows not only have very high embodied energy but also have significant environmental impacts on air quality (dioxins) during manufacture. Other American windows such as Marvin (wood) or Serious Windows (fiberglass) either offered lower thermal performance or a more limited range of coating options for tuning the glazing to the installed compass orientation to maximize passive solar heat gains for our project.
To complicate matters further there is a significant difference in window performance testing and verification between the continents. European windows are rigorously modeled for performance. However in Europe a physical example of the window is not actually tested by a 3rd party for performance verification as in United States via the National Fenestration Rating Council (NFRC) certification. One cannot understate the importance of physical verification of modeled performance.
The graph below (ZehnderUSA) shows the overall cost efficacy of the subcomponents of Passive House features. The Specific heat consumption numbers shows that, after building orientation, window performance constitutes the largest chunk of energy savings for a building. The cost efficacy units in blue are FR/kWh/a or (Swiss Francs per kWh per annum) savings and show that investing in the best possible windows is a no brainer from the perspective of energy efficiency payback.
We also see that after the investment in high performance windows, increasing the insulation of the exterior shell and employing a heat recovery ventilator (HRV) or energy recovery ventilator (ERV) are the next wisest dollars spent.
Yes, investing in high performance windows is a good investment provided they can provide a lasting energy savings over less expensive but lower performing windows. However the coastal climate of Santa Cruz involves wide swings in outdoor relative humidity levels, precipitation, drizzling fog, and extended intense direct sun & UV due to generally high ambient air quality. This is a stress factor for wood window frame materials and necessitates more frequent resurfacing/repainting even though wood frames are the most sustainable material for window frame fabrication from the perspective of embodied energy. Termites need also be considered as a risk factor with wooden windows.
This is a graph from the Canadian manufacture of pigmented fiberglass windows (Cascadia) we ultimately chose for the project. It is vendor-formatted data you have to take it with a grain of salt but I believe is in general faithful to the facts. It compares many performance attributes of the four different windows frame material types commonly available.
So why did we choose this vendor Cascadia over the rest? This can be seen from the graph below which compares cost and various performance criteria for several vendors:
Simply put, energy efficient buildings minimize reliance on artificial lighting. To achieve this they maximize the amount of natural light admitted into the building interior through their windows. As a result energy efficient buildings enjoy high natural lighting efficacy. Energy efficient buildings also need to retain interior heat very efficiently at night and during cold seasons. For windows to accomplish all this at once requires special optical coatings which transmit in the light we see (visible light) while controlling or reflecting invisible heat energy (short wave infra-red) from the inside out and from the outside in. Different vendors offer different solutions but generally a thin layer of metallic silver is deposited onto the inner surfaces of the outmost glass and the cavity is filled with an inert gas such as Argon to prevent future tarnishing of the silver. One exception is Serious Windows whose products offer good thermal performance but rely on an inner polymer film to control Solar Heat Gain Coefficient (SHGC). SHGC is the measure of the amount of short wave infrared that passes through the window from the exterior. If the SHGC is too high and there is no effective roof overhang or shading this can contribute to high summertime HVAC loads, especially in climates with a high CDD (Cooling Degree Day) load. You learn more about HDD and CDD here: http://en.wikipedia.org/wiki/Heating_degree_day. Maps for the US are here: http://en.wikipedia.org/wiki/File:United_States_Heating_Degree_Day_map,_1961-1990.jpg and here: http://en.wikipedia.org/wiki/File:United_States_Cooling_Degree_Day_map,_1961-1990.jpg.
In the case of the Serious Windows approach, the windows were dimmer that other vendors with comparable SHGC. In quantitative terms this means they are lower in natural lighting efficacy due to lower Visible Transmittance or VT, which is the ratio of the light ultimately getting through the window expressed as a fraction of the total visible light reaching the exterior of the window. Serious Windows uses internal, non-ceramic thin films between the outer glass panes, which are also absorptive in the ultra-violet band. Ultra violet light chemically alters many hydrocarbon-based materials over time. This approach may not prove as durable as triple glazed with all ceramic glass although, however in all fairness, Serious Materials offers a life warranty on their windows. The Marvin triple glazed windows are not as well performing as either the Cascadia or the other European triple glazed offerings. The Cascadia windows offer a higher Solar Heat Gain Coefficient, higher VT (more light gets indoors), and somewhat better thermal performance (lower U value) than the Marvin Windows but to not quite attain performance the European vendors. It should be mentioned the Marvin Windows had some nice features such as optional built-in bug screens and SDLs that looked very nice in the show room.
The European windows we saw on tours were, as expected, beautiful and extremely well built. Many offer an aluminum cladding over the wood frames. The Sorpetaler windows were quite impressive as seen in two other Bay Area Passive Houses. However, all of the European windows would have been burdened with very high embedded shipping energy. Since we also considered global warming potential when selecting our insulation materials we thought being consistent with the windows too would serve the overall desired project outcomes. The Cascadia windows were the best overall balance of desired outcomes at the time of our project. However this will likely change and hopefully more domestic alternatives for Passive House projects will become available domestically. The American made wooden H and H windows were very cost competitive to Cascadia. From a sustainability perspective H and H seemed an ideal choice with lower transport embodied energy (made in the US) and lower embodied manufacturing energy (wooden frames). But at the time of our project H and H had no NFRC certification. That was too high of a risk to assume since we would only learn of any shortcomings in air sealing after installation. A final vendor comment..the Inline window rep kept trying to steer us away form triple pane and towards a high performance double pane option.
This brings us to a final discussion point. Why triple paned in the comparably mild climate of Santa Cruz CA? Three reasons (1) enhanced street noise attenuation (2) enhanced winter comfort due to higher indoor glass surface temperature (3) best bang for the buck in energy savings. The fact of the matter is that once you are working with a vendor who can satisfy the air tightness requirement and window frame R values needed for a Passive House you are in a price range where much of what you are paying is for the overall build quality and engineering. The marginal savings of a few thousand dollars do ‘downgrade’ to double pane glass didn’t seem with it when considering the ancillary comfort benefits.
Getting your Passive House windows right will be an in depth exercise for the homeowners and designers requiring tremendous attention to detail and patience in working with the vendors. It is critical to ensure that the correct coatings are incorporated in each window to ensure that window’s performance relative to its compass orientation NSEW. Customer service is sometimes lacking. Be fore-warned! Our issues involved trying to avoid the ‘grilles between glass’ or GBG with our SDLs. We were unable to get a different color SDL adhesive (which adheres the SDL bar to the exterior glass surfaces). This meant using aluminum bars between the #2 and #3 glass surface to avoid the awkward visual gap when looking though the windows from an angle. The Cascadia GBG bars are thermally broken as they intercept the divider at the edge of the glass. We have been told the thermal performance as modeled by the glass unit manufacture (Cardinal USA) is not appreciably affected. We have yet to receive the exact modeling for our project..story continued.

Our Energy Baseline

Because we chose not to live in the house until the renovation is done, we don’t have an exact way to measure the energy performance improvement from the renovation.  It would be fantastic if we could say, “Our annual energy consumption at the house was 100 before the renovation and and after the renovation it dropped to 20, so we realized 80% improvement.”  That would give us a nice clean comparison, but we don’t want to live in the house while construction is going on.  So, we will be using relevant data for this “before and after” comparison.  The former resident of the house, Bob, was kind enough to provide us with access to his past utility bill data.  This provides us with an approximate baseline of how much energy was used at the house “before” renovation.  Thanks Bob!

Along with the attribute of the house, the lifestyle of the occupant plays a role in the energy consumption — what kind of electronic gadgets used in the house, what’s the preferred thermostat setting, what kind and how much cooking is done, and so forth.  You may remember that we’ve been going to various energy efficiency classes and several of the instructors suggested we gather and analyze our utility bill.  So, I did just that last week for our current home.  Our current home is a 1,300 sq.ft., 3-bedroom, 2-bathroom, 2-story condominium where we share 2 walls with our neighbors.

First, I logged on to our home account on the website of our local utility, PG&E,  and gathered data from our past billing history.  The Excel spreadsheet with the basic data looks like this.

Next, I took the gas data and graphed it over a 12-month period.  This is useful because I can tell how much gas is used for heating the condo from the shape of the curve.  How?  In our mild climate we don’t need to heat the home during the summer months.  You’ll notice that the gas usage in the months of August, September and October is constant at 10 Therms per month.  Because we have gas furnace, gas water heater, gas oven, gas cooktop and gas clothes dryer, the 10 Therms per months represent our normal usage of hot water, cooking and clothes drying.  Anything above 10 Therms is for heating.  You can see the gas usage goes up in the winter and down in the summer, where in December we’ve used up to 35 Therms to heat the house.  Here’s what the graph looks like.

Then I graphed the data for electricity.  This turned out to be pretty uniform throughout the year.  In July we were on vacation so both gas and electricity usage dipped a bit.  There is a slight bump in electricity usage in December.  I’m guessing that  we used more lights around the winter solstice when days are very short.

Interesting, isn’t?  We can further analyze the electricity data by doing some detective work.  There is a little device called, “Kill A Watt,” which measures the electricity usage of an appliance by plugging in the Kill A Watt device into the electric outlet and the appliance you want to measure into the device.  A couple of years ago Kurt went around our home and measured different equipment and found that his stereo equipment had quite a bit of vampire load or standby load.  This means that the equipment uses electricity for just being plugged in, even if the equipment is not turned on.  He immediately put his stereo on a separate power strip and turns off the power strip when he’s not listening to music.

By the way, we got a bonus credit of 20% from PG&E in March for low energy usage. They sent us a lovely email expressing their appreciation for conserving gas.

I don’t think we were consciously trying to reduce energy consumption this winter, but we were curious. So we did a little experiment to find out, “How cold does it get in the house?” by turning down the thermostat to about 50 degrees Fahrenheit.  The answer?  In the range of 60-65 degrees Fahrenheit.  Actually, I’m glad that experiment is over…

>