Keeping Cool During Heat Wave

We continue to be very happy with our Passive House.

Last week we had a bit of heat wave here.  It was unusual for Santa Cruz to have 3 consecutive days of temperatures in the mid to high nineties.  The chart below show the daily high and low temperatures (in Fahrenheit) in our area.  The Weather Cat weather station is located just 2 miles away from Midori Haus and is in a similar residential area so it provides good representative historical weather data for us.

What was really unusual about the heat wave last week was that Santa Cruz was about 10 degrees warmer than San Jose.  Normally it’s the opposite.  Have a look at this map below.  Even if Santa Cruz is south of San Jose the cool ocean temperature keeps the area mild and comfortable.  So I was surprised on Thursday last week when we drove back from Berkeley to see the temperature sensor on my car showing 96 degrees in Santa Cruz when it was only 85 degrees in San Jose. 

When we got home and stepped into the house it felt comfortable.  And we have no air conditioning.  Because of the super insulation and air tightness of the house the temperature inside the house stayed in the mid seventies during the entire time.  Here is an example of the temperature reading inside the house showing 23-28 degrees cooler than the outside.

Plotting the periodic temperature readings on this graph you’ll notice that the internal temperature stays in a narrow band while the external temperature swings wildly.

While passive house dramatically retards the heat transfer from the outside to inside (during summer) and from the inside to the outside (during winter) it does take a little bit of conscious action by the homeowner to optimize the comfort.  Let me show you what I mean.

First is shading.  Our deck that extends to the back yard faces south.  This is great in the winter because the 2 rooms facing south receive lots of good solar heat gain when it’s cold and the sun angle is low.  During the summer we want to keep the sun out.  So on Wednesday evening Kurt took out the canvas shade cloth and installed them over the arbor.  Originally we had intended to grow some plants to provide natural shading, perhaps grapes or kiwi.  But we chose not to go down that path because the shade cloth provides us with more flexibility.  After the first summer we decided to keep these shade cloth as a permanent seasonal solution rather than rely on plants because it’s easier to maintain.  Here’s a picture of that.

 Another part of the shading is inside the house.  We have these roller shades installed over the windows.  The ones on the south side of the house are all made of light-blocking thicker material we got from Advanced Blind & Shades,  and they are manufactured locally.

Then there is the setting on the heat recovery ventilator (HRV).  To minimize bringing in excess heat during the heat wave we set the control on the Zehnder ComfoAir 350 HRV to “A” during the day to reduce the ventilation flow down to 23.5 cfm from the normal 95 cfm at “2” setting.

The Zehnder ComfoAir 350, as with other heat recovery ventilators, has the ability to perform passive night time cooling in climates where hot daytime summer temperatures are followed by cool evening temperatures. These are climates in which one would normally open the windows at night. 
Using the HRV “Summer Bypass Mode” allows all the benefit of night time cooling with the windows the added benefit of retaining the filtration of air introduced into the home interior. It allows for a cooling to a precise user selected set point and then resumes its temporarily defeated heat exchange function.

Finally, we open the windows and let the cool air in during early morning.  As you’ve seen from the daily low temperature in from the Weather Cat table above it gets nice and cool overnight.  Typically in the mid to high fifties even during the heat wave.  This really helps to reset the internal temperature before the day heats up again.

By the way, this night or early morning cooling works because the ocean temperature is pretty constant and cool throughout the year.  The table below is the average ocean water temperature from NOAA.  You can see from the table that the water temperature just a mile away from our house is abut 56 degrees Fahrenheit, plus or minus 3 degrees.  Once the sun goes down the cool ocean water cools the air so the overnight temperature is consistently cool.  That’s why homes in Santa Cruz don’t have air conditioning.

Because we don’t have air conditioning we don’t use extra electricity during hot weather.  Our electricity usage continues to stay pretty low during the heat wave of May 13-15, 2014.  Below is the screen shot from PG&E, our local utility, showing our electricity usage for the current month. 

We are happy to be comfortable in our Passive House that uses very little energy.

Solar Thermal System

December 6, 2013

You’ve got to be careful if you don’t know where you’re going because you might not get there.
– Yogi Berra

It took us a long time to decide on the system to provide hot water for the house.  Partly because we were going through a steep learning curve but mostly because the destination we set out for was somewhat broad.  It was analogous to going on a road trip by having the target destination specified with just the city name but not the specific street or the address.  So we were very careful because there were were many paths to get there and the recommendations from various experts did not converge.  Each expert we spoke with had a different take on the path and each one of them had a very strong opinion. We were so flummoxed that we stopped construction for 2 months while we sorted this out.  One lesson we learned was that there are many different ways to achieve water heating and you need to decide on the right solution for your situation.  There is no silver bullet.  Another lesson is “How you frame the question influences the solution,” and finally,”The clearer the goal, the clearer the path to the destination.”  I will spare you the drama of this journey and will instead present the journey in a summary fashion broken down into 4 phases – (1) Requirements, (2) Design, (3) Installation, and (4) Results Measured.  Before we embark on this summary journey, take a peek at the finished mechanical room.

(1) Requirements

The broadest statement of our goal was to “Have a hotwater system that minimizes the carbon footprint for our draw profile.” Now let’s break this down into 2 parts – draw profile and carbon footprint.

The “draw profile” or how we use hot water can be categorized into 3 parts.  First is the day-to-day use of washing hands (short draw) and showers/baths (long draw).  The second part is the hot water demand from appliances, specifically dishwasher and washing machine.  Both of our appliances (Miele Futura Dimension dishwasher and Bosch Axxis+ clothes washer) are quite efficient in their water usage and have their own water heating elements built in.  This means the warmer the temperature of the incoming water, the less energy it will take to heat the water to meet their program cycle.  The third part of our draw profile, the ofuro or soaking tub, represents the ultra long draw.  You see, one of the outcomes I wanted from Midori Haus was to have a par-boiled experience of soaking up to my chin in hot water that was at least 110F degrees.  The soaking tub we selected (MTI Yubune #77) has a capacity of 155 gallons.  This ultra long draw is not an everyday event but a random, once in a while event that didn’t fit into the average household hotwater draw profile.  This is a luxury behavior we decided to keep within scope to promote the happiness and well-being of the occupants of the house.

You may ask, “Why do you want to minimize carbon footprint?”  The simple answer is this:  Because we want to do something tangible in our personal space we control that reduces impact on climate change.  “OK, that’a a noble goal,” you might say, “and tell me how your choice in water heating system affects climate change.” Well, you can heat water at home by different means.  The sun can directly heat the water using the solar thermal system.  Electricity can heat the water using heat pump technology.  Gas boiler can heat the water.  Each approach has pros and cons.  The most important outcome we desire is to minimize the use of source energy at power plants.  Why?

  • Unless you live off the grid (i.e. not connected to the utility infrastruture where you produce electricity at your home and having a battery storage system to power your house when the sun is not shining) you’re getting your electricity from your utility company.  Should you be inclined to watch an entertaining and informative video on electricity for 5 minutes, have a look at Energy 101: Electricity Generation.
  • You’ll note from the video that the electricity power plant is a big steam engine that turns the turbine which spins the magnet to produce electricity.  The amount of energy needed to heat the big steam engine is about 3 times the amount of electricity produced.  If you have the appetite to consume mathematical formulas that explain the Rankine cycle and the efficiency of power cycles I invite you to visit Thermopedia.  There are different ways of turning the turbine (dams at hydro electric plant, wind farm, burning coal, nuclear) and in the worst case scenario for every 1 unit of electricity that reaches your home 3 units of energy was burnt at the source (power plant).  So, if we minimize the use of electricity at home including water heating we minimize the carbon emissions at the power plant and reduce our impact to climate change.

With the focus on minimizing source energy, we refined our requirement further by selecting solar thermal system with a tiny solar electric PV panel to avoid drawing any electricity from the grid to run our hotwater system.  When we have continuous cloudy, rainy days the solar thermal system will need backup heating.  For this we chose a gas boiler since we planned to have an outdoor barbecue plumbed with natural gas.

With these requirements defined let’s look at the design of the solar thermal system at Midori Haus.

(2)  Design

We gave our requirements to Patrick Splitt of App-Tech to design the solar thermal system.  He designed an elegant system to meet our needs and provided us with detailed drawings and equipment list.  Instead of sharing the detailed design on this post I’ll briefly describe system using my diagram below.

At the heart of the system is the indirect tank from TriangleTube, model SME120.  This is a tank within a tank where the water stored in the outer tank (66 gallons) heats the inner tank (105 gallons) that is used for heat storage and domestic hot water.  Note that the water in the 2 tanks never mix — the outside tank water is used strictly for heat exchanges and the inner tank is used inside the house for washing and bathing.  The tank has 2-inches of polyurethane foam insulation built into the tank to minimize standby loss and we further wrapped the outside of the tank with few layers of bubble foil insulation to really keep the heat in.

The water in the outer tank is heated by the heat exchanger coil in the bottom of the outer tank.

When the sun is shining the tiny photovoltaic (PV) panel generates electricity to power the pump that circulates propylene glycol in the heat exchanger coil up to the Heliodyne solar thermal panel.  This is a clever design because the pump would never circulate the heat exchange fluid to cool off at night.

If the temperature of the hot water in the inner tank drops below 120F the aquastat sensor would trigger a signal to kick on the gas boiler to heat the water in the outer tank.  The CC125S Challenger Solo Boiler from TriangleTube is designed to work together with the SME120.  It is energy efficient with up to 94% AFUE.

The hot water in the outer tank is also used for space heating inside the house.  The thermostat in the hallway controls the pump to circulate hot water through the water-to-air heat exchanger (think of this as a box similar to car radiator) located next to the heat recovery ventilaor (HRV).  Details of the HRV will be covered in a different post.

The combination of SME120 and CC125S allows us to maximize the use of heat energy from the sun.  This is another clever feature of the design we like because this allows us to use the hotwater heated by the sun at night and reducess short cycling caused by “cold water slug”in the pipe.

(3) Installation

The solar thermal system was installed by Duane Wilson of Wilson Hydronics in the mechanical room. The mechanical room is a compact 38 square feet space located on the south-west corner of the house.  Note that the mechanical room is outside of the air-sealing envelope of the house.

The solar thermal panels are made by Heliodyne, a solar thermal company located in the San Francisco Bay Area.  We used 3 of the flat plate collectors (Gobi 408 001) and rack mounted them on the south roof at 45 degrees angle.  Installing the panels at an angle helps to product more heat in the winter when the sun angle is lower.  

The copper pipes that run from the mechanical room to the panels on the roof are insulated with 1″ self sealing Armaflex tubes.

The controller to run the pump that sends propelyne glycol to the panels on the roof is from Art-Tec Solar.  The small PV panel on the roof next to the mechanical room generates electricity to operate the pump to circulate glycol through the solar collectors on the roof.  This ony operates when the sun is shining so we avoid cooling off the glycol heat transfer fluid  at night or during rain.

The vent you see on the flat roof is for the Challenger Boiler.

SME 120 indirect tank — before and after bubble wrap insulation.


Challenger boiler – CC125S.


To minimize scaling in the hot water system we installed the Heater Treater from Falsken Water Treatment System.

There are many more interesting stuff in the mechanical room, such as expansion tanks, pumps, check valves, etc.  If you want to see the full detail, I invite you to attend one of our public tours of Midori Haus.

(4) Results Measured

“Is it comfortable?” and “How much energy did it take to provide adequate hot water for space heating?” are the two questions that are important to us.  So I will share our data from WELserver and PG&E to answer those questions.

Is it comfortable?  Yes, it feels comfortable in the house.  Let me show this to you with data.  Below is one of the signs I posted on the wall for the Passive House Days tour about 1 month ago.  The green screenshot on the right is from the WELserver we installed in our house reporting the temperature, humdity and VOC measurements from different rooms in the house.  There will be a different post on WELserver to describe it in greater detail.  The left side overlays the temperature measurements on the layout of the house.  As you can see, this data shows the house having a comfortable temperature range of 68 – 72 degrees Fahrenheit in the middle of the night when the external temperature is at 48F.

A more recent example displays the low heating demand for the house.  Data below was taken this morning at 8:30 A.M., after the sun had been shining for 1.5 hours.  Overnight low temperature was a very cold 28F.  This is very cold for our mild climate here and we did an overnight experiment where we turned off the heat recovery ventilator (HRV) to see how the house performs by relying on the super-insulation and the ultra tight air-sealing to keep the internal heat gains inside the house.  Below you see the temperature in the rooms of the house dropping a few degrees to 64 – 67 degrees Fahrenheit range.  This means that the heating system only needs to bring up the air temperature in the house by few degrees to keep it comfortable.  When energy modeling calculation was done using the Passive House Planning Package (PHPP) we learned that the house would need less energy than a hair dryer would use to keep it warm.

One anomaly you may notice below is the wide temperatures range of the exterior – south deck is 71F and the front porch is 33F.  In this case the front porch temperature is more representative of the actual outside temperature.  The south deck receives direct sun and the sensor gets pretty warm after having the sun beating down on it for 1.5 hours.

How much energy did it take to heat the hotwater?
The solar thermal system needs a boost from the boiler every now and then when the temperature of the inside tank dips below 120F.  This could be caused by standby loss (tank losing heat to the cold air surrounding the tank) or when there is a big draw (filling the soaking tub).  We used the soaking tub about 3 times during the summer and the temperature of the hotwater in the inner tank never dipped below 120F so the gas usage on our utility bill from PG&E is mostly from the boiler.  The few therms we used in the summer is probably due to the outdoor gas barbecue.

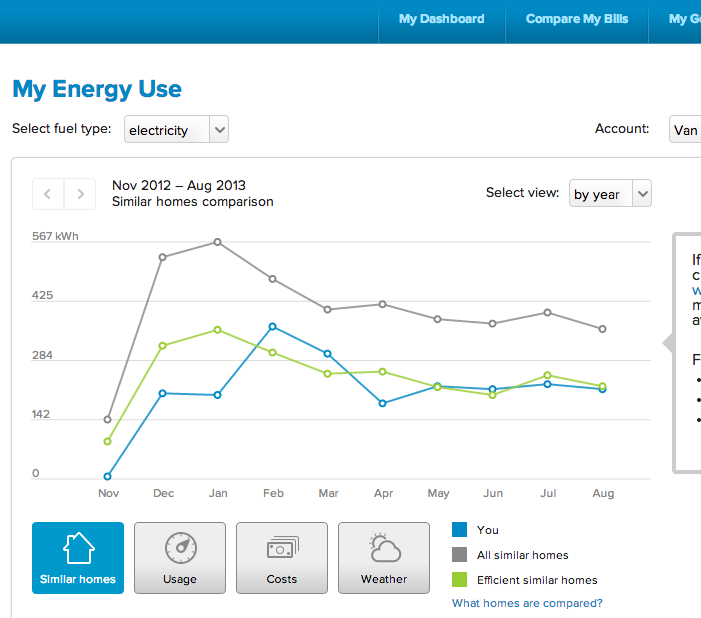
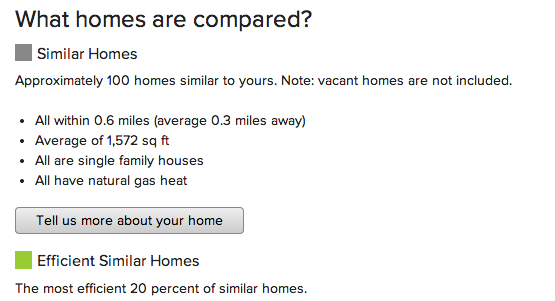
Our natural gas usage is indicated by the blue line in the graph above.  As you can see the gas usage is just a fraction of what similar homes use.  The definition of similar homes represented in this graph are 100 homes of similar size within 0.6 miles radius that use natural gas for space heating.

What About Cost?

You may have noticed that “lowest cost solution for minimal hot water use” was not part of our criteria in designing our solar thermal system.  We wanted to be comfortable and splurge with a nice soak every once in a while.  After agonizing over the high price tag we stuck to our goal of minimizing our carbon footprint by avoiding the use of electricity for hot water heating.  So we accepted the high price tag to implement this elegant solution and we hope this system will be with us for a long time.   We are using about 350 therms/year less than similar homes in the area but with natural gas prices being so low it would take a long time to pay back the higher cost of this system compared to some other approaches. The bright side is that we won’t feel the impact of natural gas price hike in the future because we use so little of it.  Also, we have resiliency built into our dwelling becaues we will have hot water during blackouts and gas outages.  As long as the sun is shining we will have hot water.

Conclusion

The solar thermal system we implemented is just one approach to heating water at home.  There are many paths to generating hotwater.  We chose this approach because of our desire to reduce carbon footprint and meet the needs of our hotwater usage.  It’s not a solution for everyone.  Some of our friends who are remodeling their homes in an environmentally conscious way have adopted a different approach.  They are going all electric by installing PV on their roof and are using heat pump water heater that could generate 3~5 watts of hot water for every 1 watt electricity used by the pumps and fans.  They also were concerned about carbon and chose to avoid natural gas because of methane leakage at the fields where natural gas is extracted.  I’m happy for them for choosing a solution that best meet their requirements.

What’s important, I believe, is to be clear about your desired outcomes and decide for yourself and share the results with others.  The real validation of the system is when the contractor who installed your system implements the same at his house.  We’ll see if this happens.

Energy Usage: First 8 Months

September 1, 2013

Are you curious how much energy Midori Haus uses and how it compares with other houses in the area?  The proof is in the utility bill.  When I get the utility bill from Pacific Gas & Electric (PG&E) each month via email I always log in to their site to look at the “My Usage” tab to see how our electricity and natural gas usage compare with similar homes in the area.  Take a look at these screen shots:

Our electriity usage averaged 227kWh per month for the last 6 months (Mar-Aug).  You can see from the graph that our usage (blue line) is pretty low, tracking closely to the efficient homes (green line) in the area.  The house was in construction through January and we started living full time in the house on March 15, 2013 when the blinds for the windows were installed.

Electricity usage was a bit higher in February and March when we had several fans and vaporizers running 24/7 to remove the smell coming from the stains applied to the fiberglass door.  Usage was low in April when we were on vacation for 10 days.

 Our natural gas usage averaged 1.8 Therms per month for the last 6 months (Mar-Aug).  Our gas usage (blue line) is just a fraction of similar homes in the area and even lower than the most efficient homes in the area.

We use a gas boiler as a backup heat source for domestic hot water.  Primary source of heat for the hot water is the sun.  We have a solar thermal system (to be explained in a separate post) that pre-heats the hot water.  We also have a natural gas barbecue grill out on the deck.  That accounts for the little blip in gas usage in the summer — 2 Therms in June, 1 Therm in August.

You may wonder what homes are compared in these graphs.  PG&E does a good job of giving us an apples-to-apples comparison.  The definition of similar homes for us is single family houses with an average of 1572 sq ft using natural gas heat within 0.6 miles.

Our house is technically heated by gas because PG&E does not have a category for homes heated by the sun.  How is our house heated?  When the temperature in the hallway thermostat dips below 68F a pump in the mechanical room turns on to circulate hot water (mostly heated by the sun) through the hydronic coil in the house.  The hydronic coil is used to warm up the air in our ventilation system. For a typical house this amount of heat is not enough to make it comfortable.  But Midori Haus is a passive house that is super-insulated and super-airtight.  So we only need the equivalent energy of half a hairdryer to heat our home in the winter.  Should the temperature in the hot water tank dip below 120F then the backup gas boiler turns on, thus the house is technicall heated by natural gas.  But as you can see from the graph above this doesn’t happen regularly.  The higher usage of natural gas in January and February reflects the start-up condition for the hot water heater.  The storage tank and the backup gas boiler were installed and turned on in January when it was cold outside and the sunlight duration short.  So the gas boiler did bulk of the work to heat up 165 gallons of water to 120F.  It’s amazing that we only used only about quarter of natural gas that similar homes used in January and the house was comfortable.

The amount of energy reflected in the utility bill is not only for heating the house.  A good portion is attributed to appliance choices and our behavior.  At Midori Haus we use electricity for cooking, clothes washing, lighting and handful of gadgets plugged into the wall.  When we lived in the 1300 sq ft condo we had lots of gas appliances — wall furnace, standard hotwater heater, stove and oven.  So I expected our electricity usage to be a bit higher at Midori Haus than at our condo.  And it is a bit higher but not by much.  To compare the energy usage between similar seasons I grabbed a few screen shots of the energy usage at our condo in 2012:

 The monthly electricity usage averaged about 147 kWh for the condo for the same period last year (Mar – Aug 2012). Some of the gadgets consuming electricity are the same — laptop computers, stereo, hair dryer, coffee grinder, etc.  The occupant behavior is somewhat similar too.  The difference in occupant behavior is that I spend far less time at Internet cafes now.  Back in 2012 when I was uncomfortable at the condo (I thought it wasn’t warm enough) I packed up my computer and hung out at the local coffee shops.  Now I don’t do that.

 The gas usage at our condo has an interesting story.  In the winter of 2011-2012 we did an experiment of setting the thermostat for our wall furnace really low and wore layers of sweaters to keep warm.  In our mild climate in Santa Cruz if you set your thermostat at 55F in the winter it hardly turns on.  I thought our gas usage would be pretty flat to track with the summer usage pattern.  But it didn’t.  It was lower than similar homes and the curve rather bumpy. The winter usage went up as if we were turning on the wall furnace but we did not.  Our gas usage (blue line) was even higher than efficient similar homes.  What’s going on?  The likely culprit is the water heater.  The gas water heater at the condo was located in a cabinet next to the refrigerator in the kitchen.  It’s in the conditioned space so it had no insulation around the water heater.  This is OK for most times when the kitchen temperature is between 68F and 72F, but not when the kitchen temperature is at 58F.  So the water heater was using more gas in the heater to keep the water warm.  Interesting, isn’t?

 The similar homes for the condo are all apartments or condos with natural gas heat located within 0.9 miles.  Our condo shared 2 walls with our neighbors so 50% of the walls are well-insulated.  But it is definitely not airtight and I was often cold in the winter.  People in cooler climate may laugh when I complain about it being cold in the winter here but I grew up in Hawaii where it’s nice and warm.

It’s hard to compare the energy bills of homes with different types of appliances (e.g. gas stove top vs. induction cooktop, gas clothes dryer vs. electric condensing clothes dryer, gas wall furnace vs. hydronic coil).  To do an apples-to-apples comparison I took the 6 months data (Mar – Aug 2013) for Midori Haus and the 6 months data for the condo (Mar – Aug 2012) and converted the gas usage (measured in Therms) to equivalent electricity usage (measured in kWh).  1 Therm is equivalent to 29.307 kWh.  Plotting this combined usage data on a graph I found the Midori Haus total energy usage to be much less than the total energy we used at the condo.  It’s the same people with same occupant behavior but  living in a different space.  This means the dwelling itself is much more energy efficient and the space is much more comfortable.  Passive house is amazing.

Beginning of Air Sealing

Why Air Sealing?

We want our house to be comfortable, durable and energy efficient.  So air sealing is an important element in meeting those criteria.  You know that air can pass through small cracks, spaces and even pin holes, right?  For example, if you see daylight in the door frame when it’s closed you’ll feel a draft standing next to it when it’s cold outside and warm inside.  Then if you put weather stripping around it to prevent air flow the house feels more comfortable, right?  So, stopping air leakage leads to comfort.

Air sealing also leads to durability of the building because air can transport moisture.  You might ask, what’s the connection to durability?  Well, remember the pictures of rotted skip sheathing due to rain water intrusion?  Prolonged water exposure can cause wood to weaken and also invite mold to grow.  Not good for durability of the structure nor the health of occupants.  Let’s imagine a hypothetical example for illustrating why moist air passing through cracks in the walls is bad for durability.   Say there’s a lot of cooking going on in the kitchen and the indoor temperature is 80 degrees with 50% humidity and the outside temperature is 40 degrees.  The dew point (the temperature that vapor in the air changes to liquid) is 59 degrees.  Warm air can hold more moisture than cold air.  So for a given relative humidity, the the surrounding air temperature will determine if it will stay in the air as moisture or condense to liquid and become water.  For an explanation of using simplified psychrometric chart have a look at this guide on air properties from NebGuide.  In this hypothetical example the warm air leaking through the kitchen wall will to the outside will encounter drop in temperature along its path and when the temperature drops below dew point the moisture vapor will change to liquid water.  If the cold surface happens to be the insulation layer it will get soggy and dampen the wood around it and if it doesn’t dry out over a period of time there will be rot and maybe mold.  So, stopping air leakage leads to durability.

Air sealing is good for energy efficiency.  Imagine driving in your car with the windows open in the winter.  The heater is on in the car but the hot air is escaping through the window.  When you close the window it’s warmer because the heat is no longer escaping through the window and you can use a lower temperature setting to stay comfortable.  Same thing with the house.  If you have the windows open you use more energy to heat the house than if you had the windows closed.  The opening and closing of the windows are something we can do voluntarily to control and minimize the use of energy to heat the house.  The air sealing of small cracks and spaces are like having lots of tiny miniscule windows that we can’t close.  Some of these cracks are buried under layers of building material and homeowners can’t get to them easily.  So we rely on the builders to ensure that these miniscule uncontrollable windows in the house at different stages of construction.

Air Sealing Examples

When we’re talking about air sealing for passive house standard the builder is taking steps to mitigate air leaks from tiny spaces like gaps between two pieces of wood on a top plate, mudsill, etc.  To refresh your memory, we are striving towards Passivhaus certification and the airtightness goal is 0.6 air changes per hour (ACH) at 50 pascals.  If you recall our baseline blower door test came in at 22 ACH.  This means we are targeting the house to be 3600% more airtight than the original house!

By the way, you may want to take a look at this page for a brief overview of Passivhaus.

Air sealing work on the wall framing was done prior to sheathing.  These guys examined the places were unintended airflow could occur, like the junction of mudsill and studs, corners, etc.  Below are some pictures of air sealing examples.

To prevent air leakage in the small pinhole openings the crew shot foam
into the openings, sometimes drilling through the stud to access a spot where
the foam could expand and fill all the crevices, then sealing the outside with
a tape.  The crew tended to this
tedious work diligently towards the goal of 0.6 air change per hour at 50
pascals.  
Here are some examples of air-sealed spots where foam was blown in and covered up with tape.
Sealant from Perma Chink was applied with a bulk loading gun to ensure sealing of the sheathing to the wall studs.
>