Balancing Airflow in our Zehnder HRV System

This post is about the adjustments I’ve made to our heat recovery ventilator (HRV) system to balance the incoming and outgoing airflow. While you may find this post helpful, please consult your HRV professional before making any adjustments to your system. I wrote this post mainly to remember what I did.

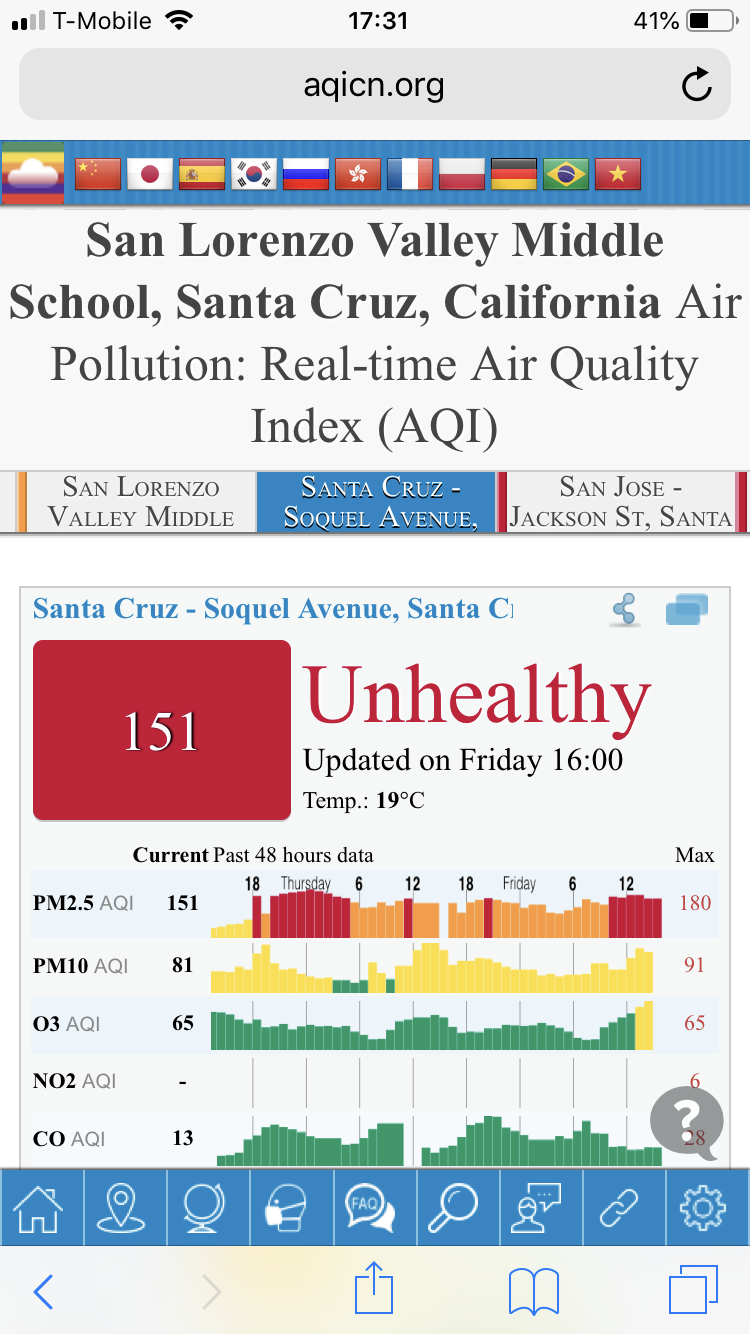
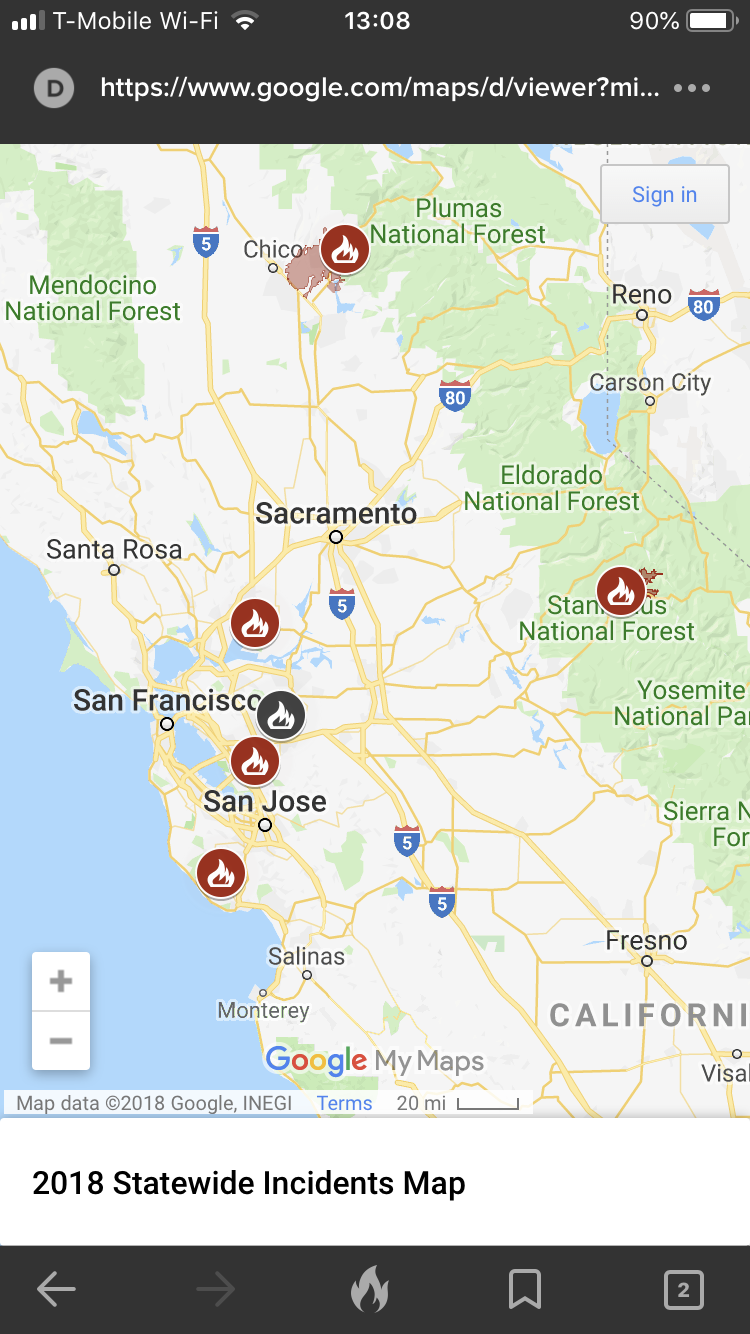
Our Zehnder ComfoAir 350 HRVwas installed about 6 years ago. Our home, Midori Haus, is a certified Passivhaus so the house is very airtight (0.6ACH50). Having an effective ventilation system is important for comfort and health. My husband and I wanted to install the yellow particle filter, rated at MERV15, near the air intake. After experiencing extended poor outdoor air quality days during the 2018 California wildfire season, we thought this was prudent. Adding an extra air filter would increase the resistance in the incoming airflow. We expected the incoming air flow be reduced, but didn’t know how much, so we measured it.

Equipment Used

I did the work myself. Tools used for this work included:

  • Ladder – to reach diffusers installed in 9-foot ceiling

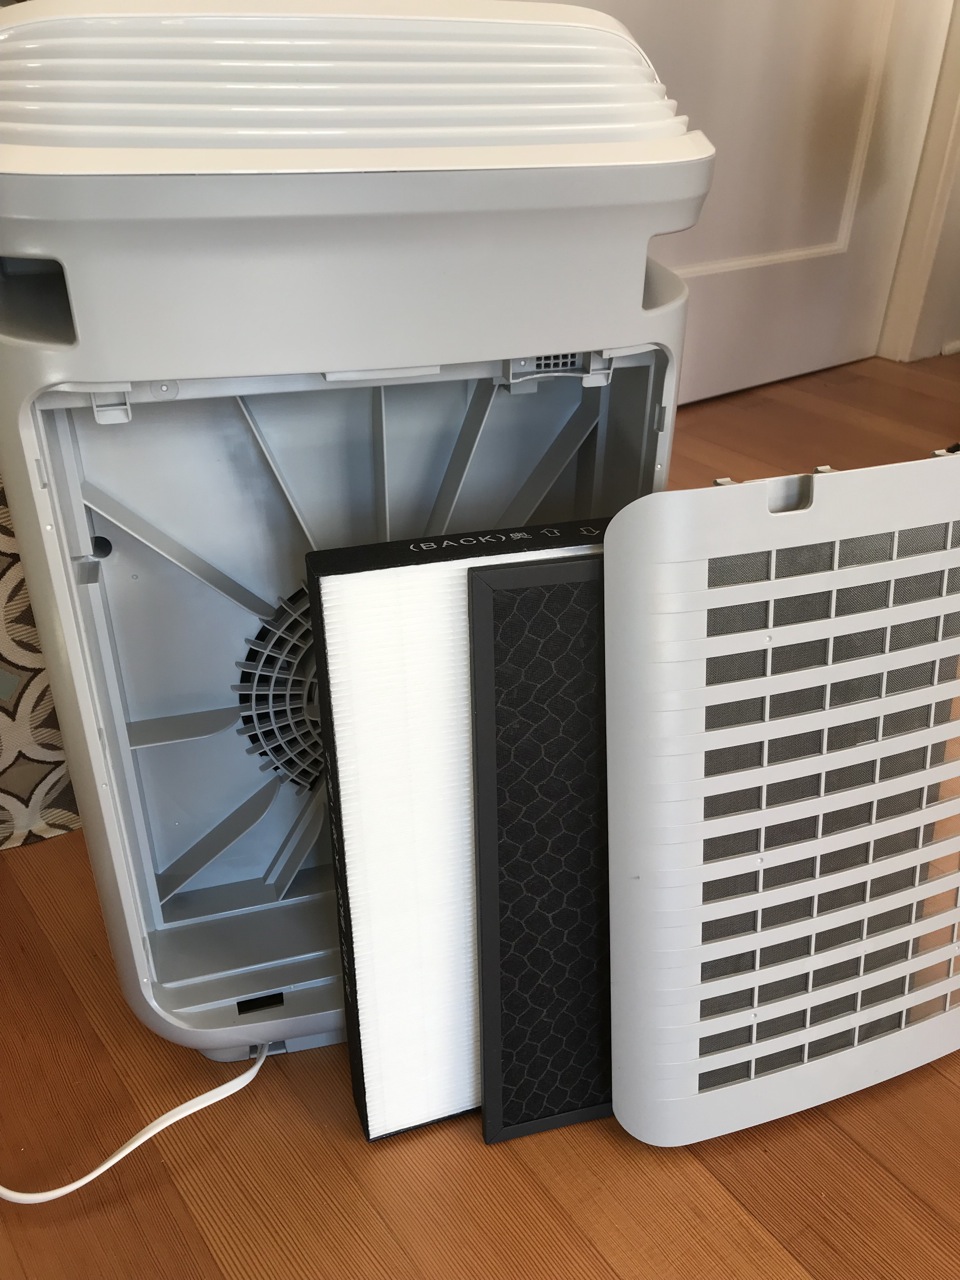
The system we have in place is a Zehnder ComfoAir 350 HRV with F7 red filter (MERV 13)for supply, G4 black filter (MERV 7 / 8)for exhaust, and CW-FC 320 activated carbon filterin ComfoWell.

Baseline Measurement

First task was to take a baseline measurement before installing the new filter. I took the balometer to each of the 13 diffusers inside the house and measured the airflow.

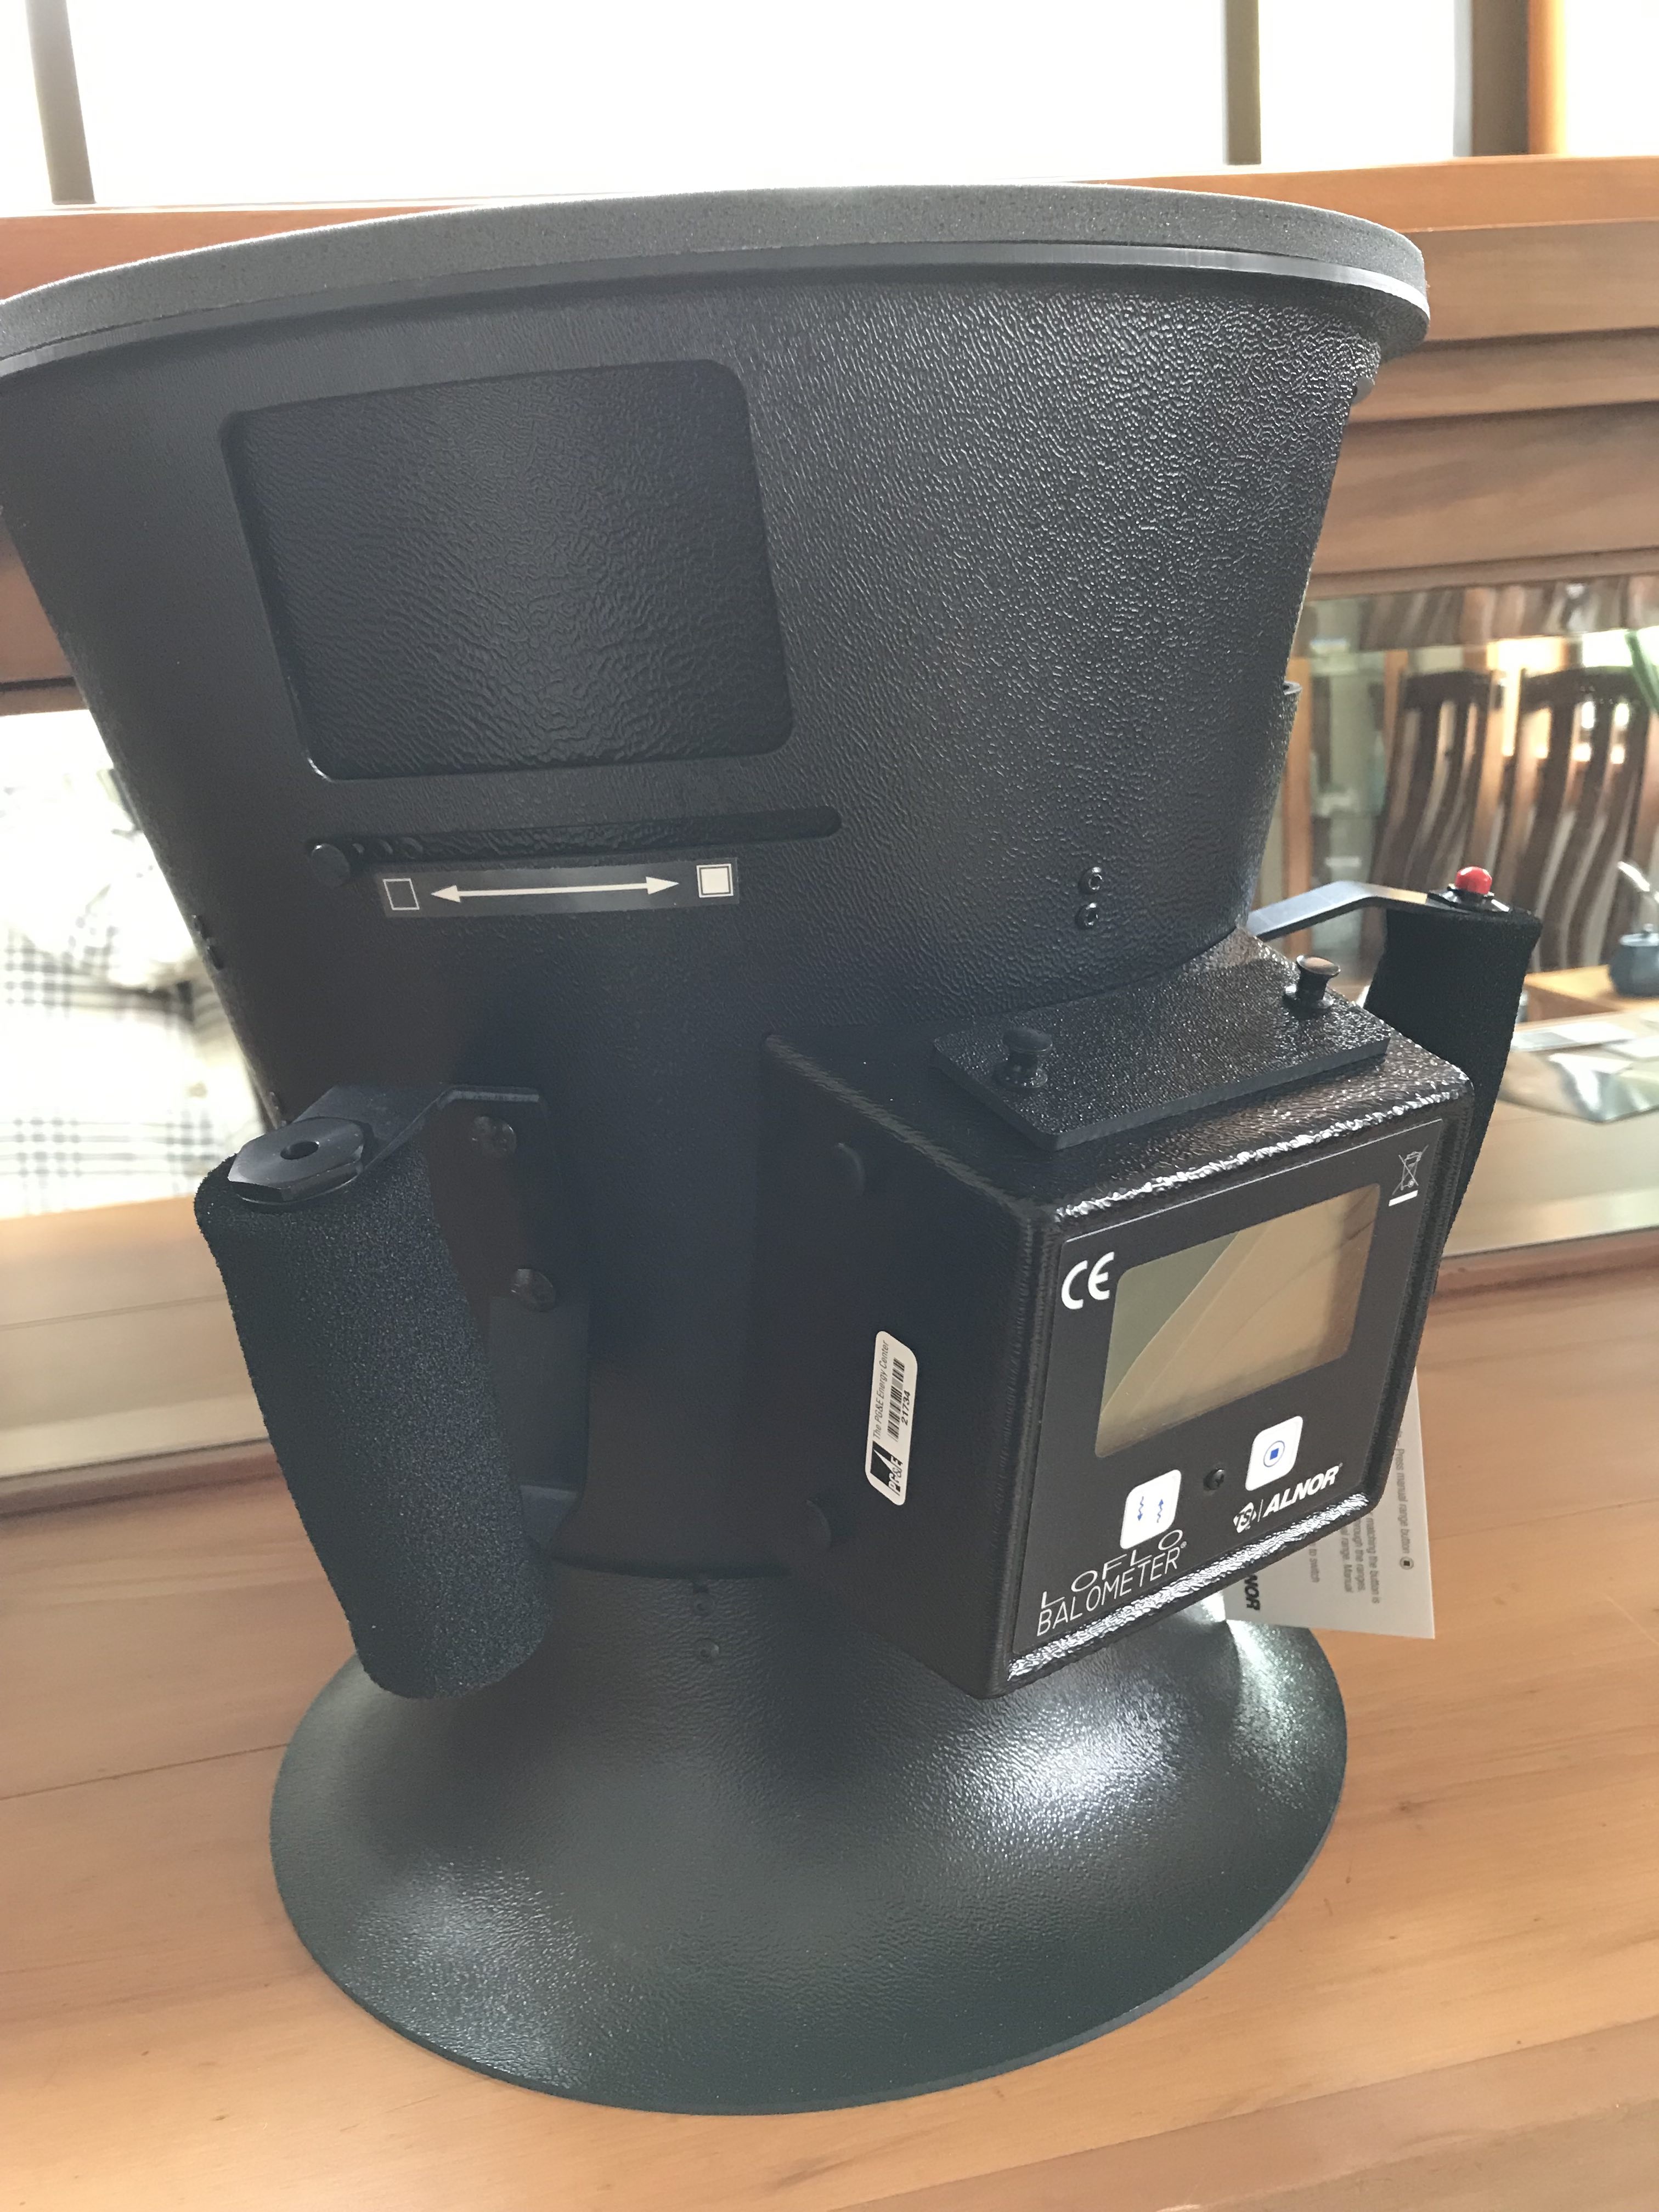
Alnor Loflo balometer (6200D)

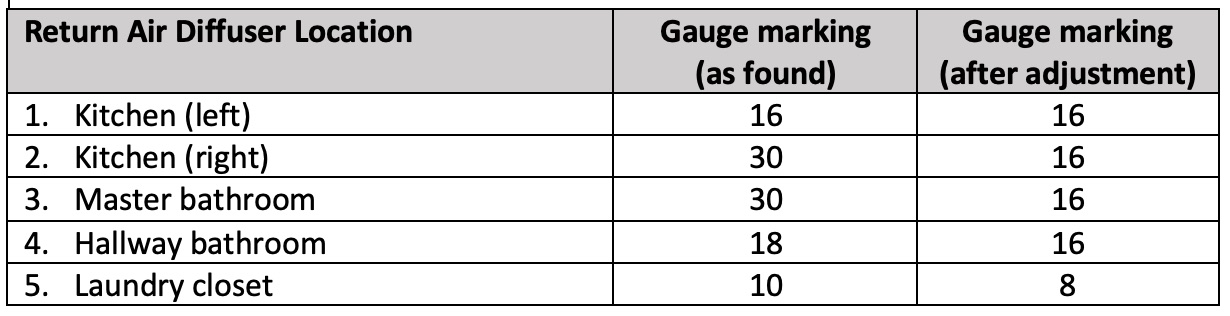
Here is the baseline measurement:

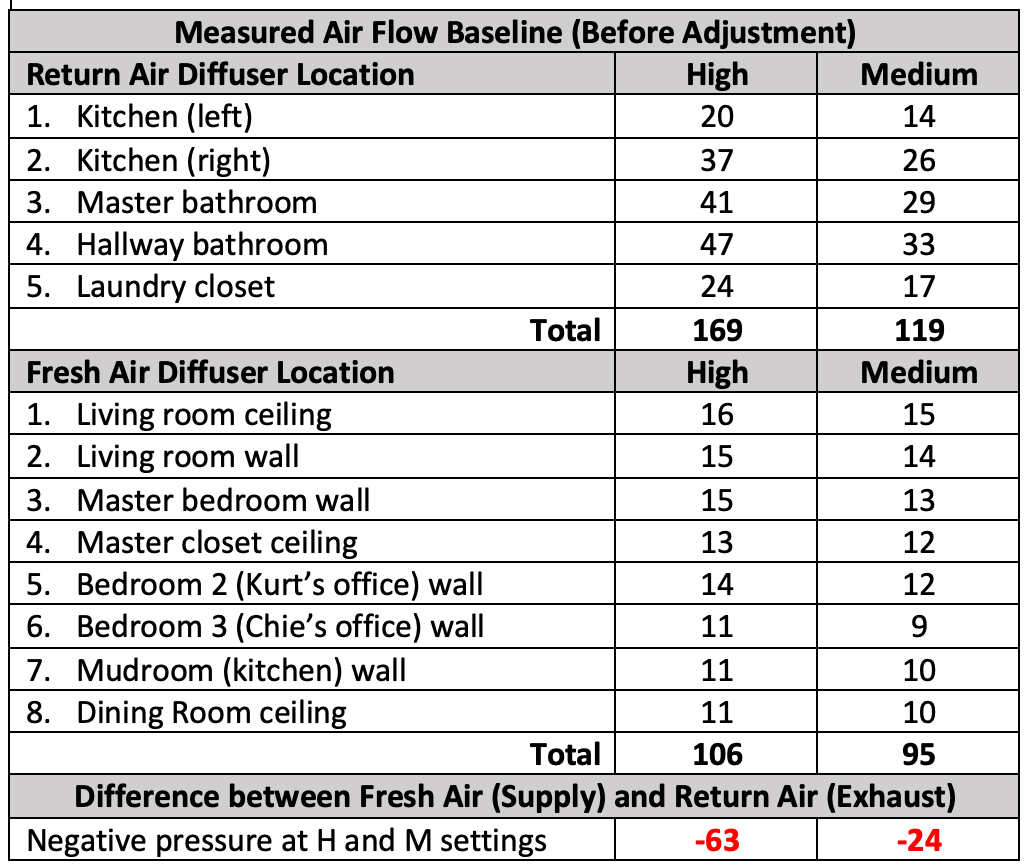
Though I suspected there would be a slight negative pressure, I was surprised to see these numbers confirming it. I compared these numbers to the commissioning report from January 2013 and noticed that:

  • Return Air (Exhaust) total was much higher (25%) than the original commissioning numbers. I suspect we caused this when we cleaned the dust out of the diffuser, we didn’t place them back to their original setting.
  • Fresh Air (Supply) total was slightly lower (2% ~ 6%) than the original commissioning numbers. This can be attributed to the installation of the activated carbon filter near the supply intake. The ComfoWell box was installed in October 2013 and we haven’t balanced the air flow at that time.

Note to self: Next time you clean the diffuser, put them back to the same settings as you found them!

Adjust Return Air (Exhaust) Diffuser Opening

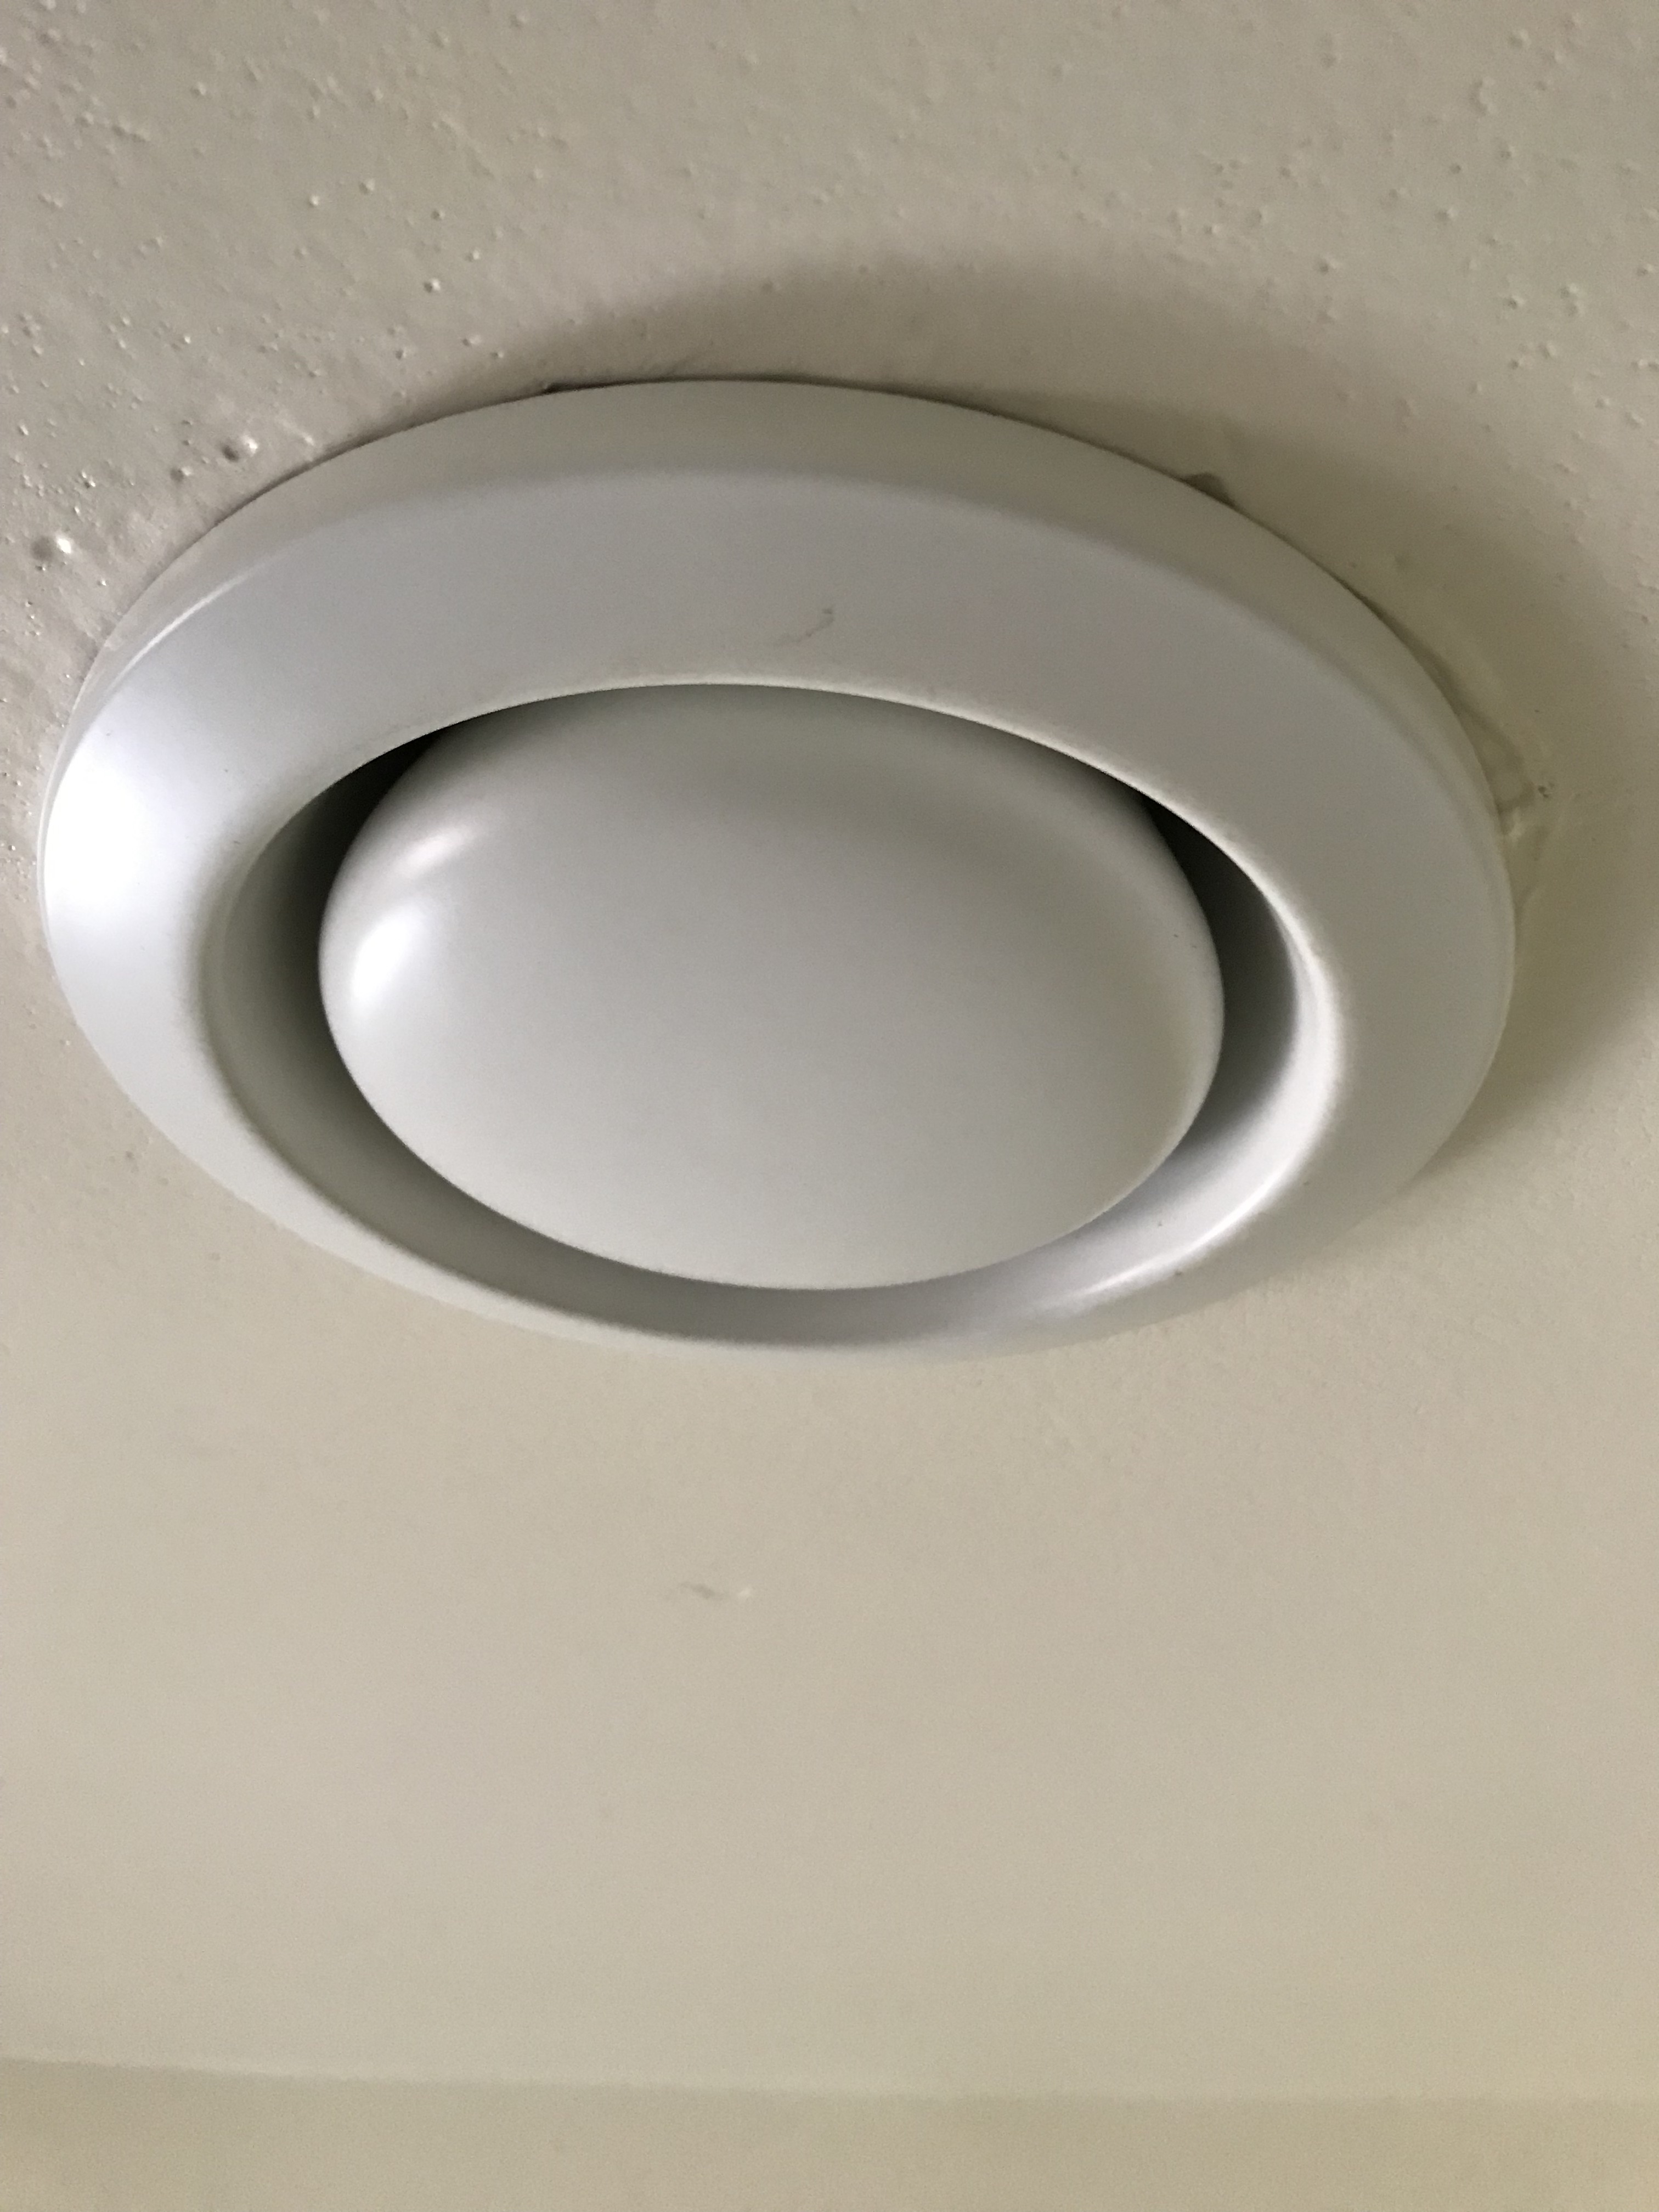
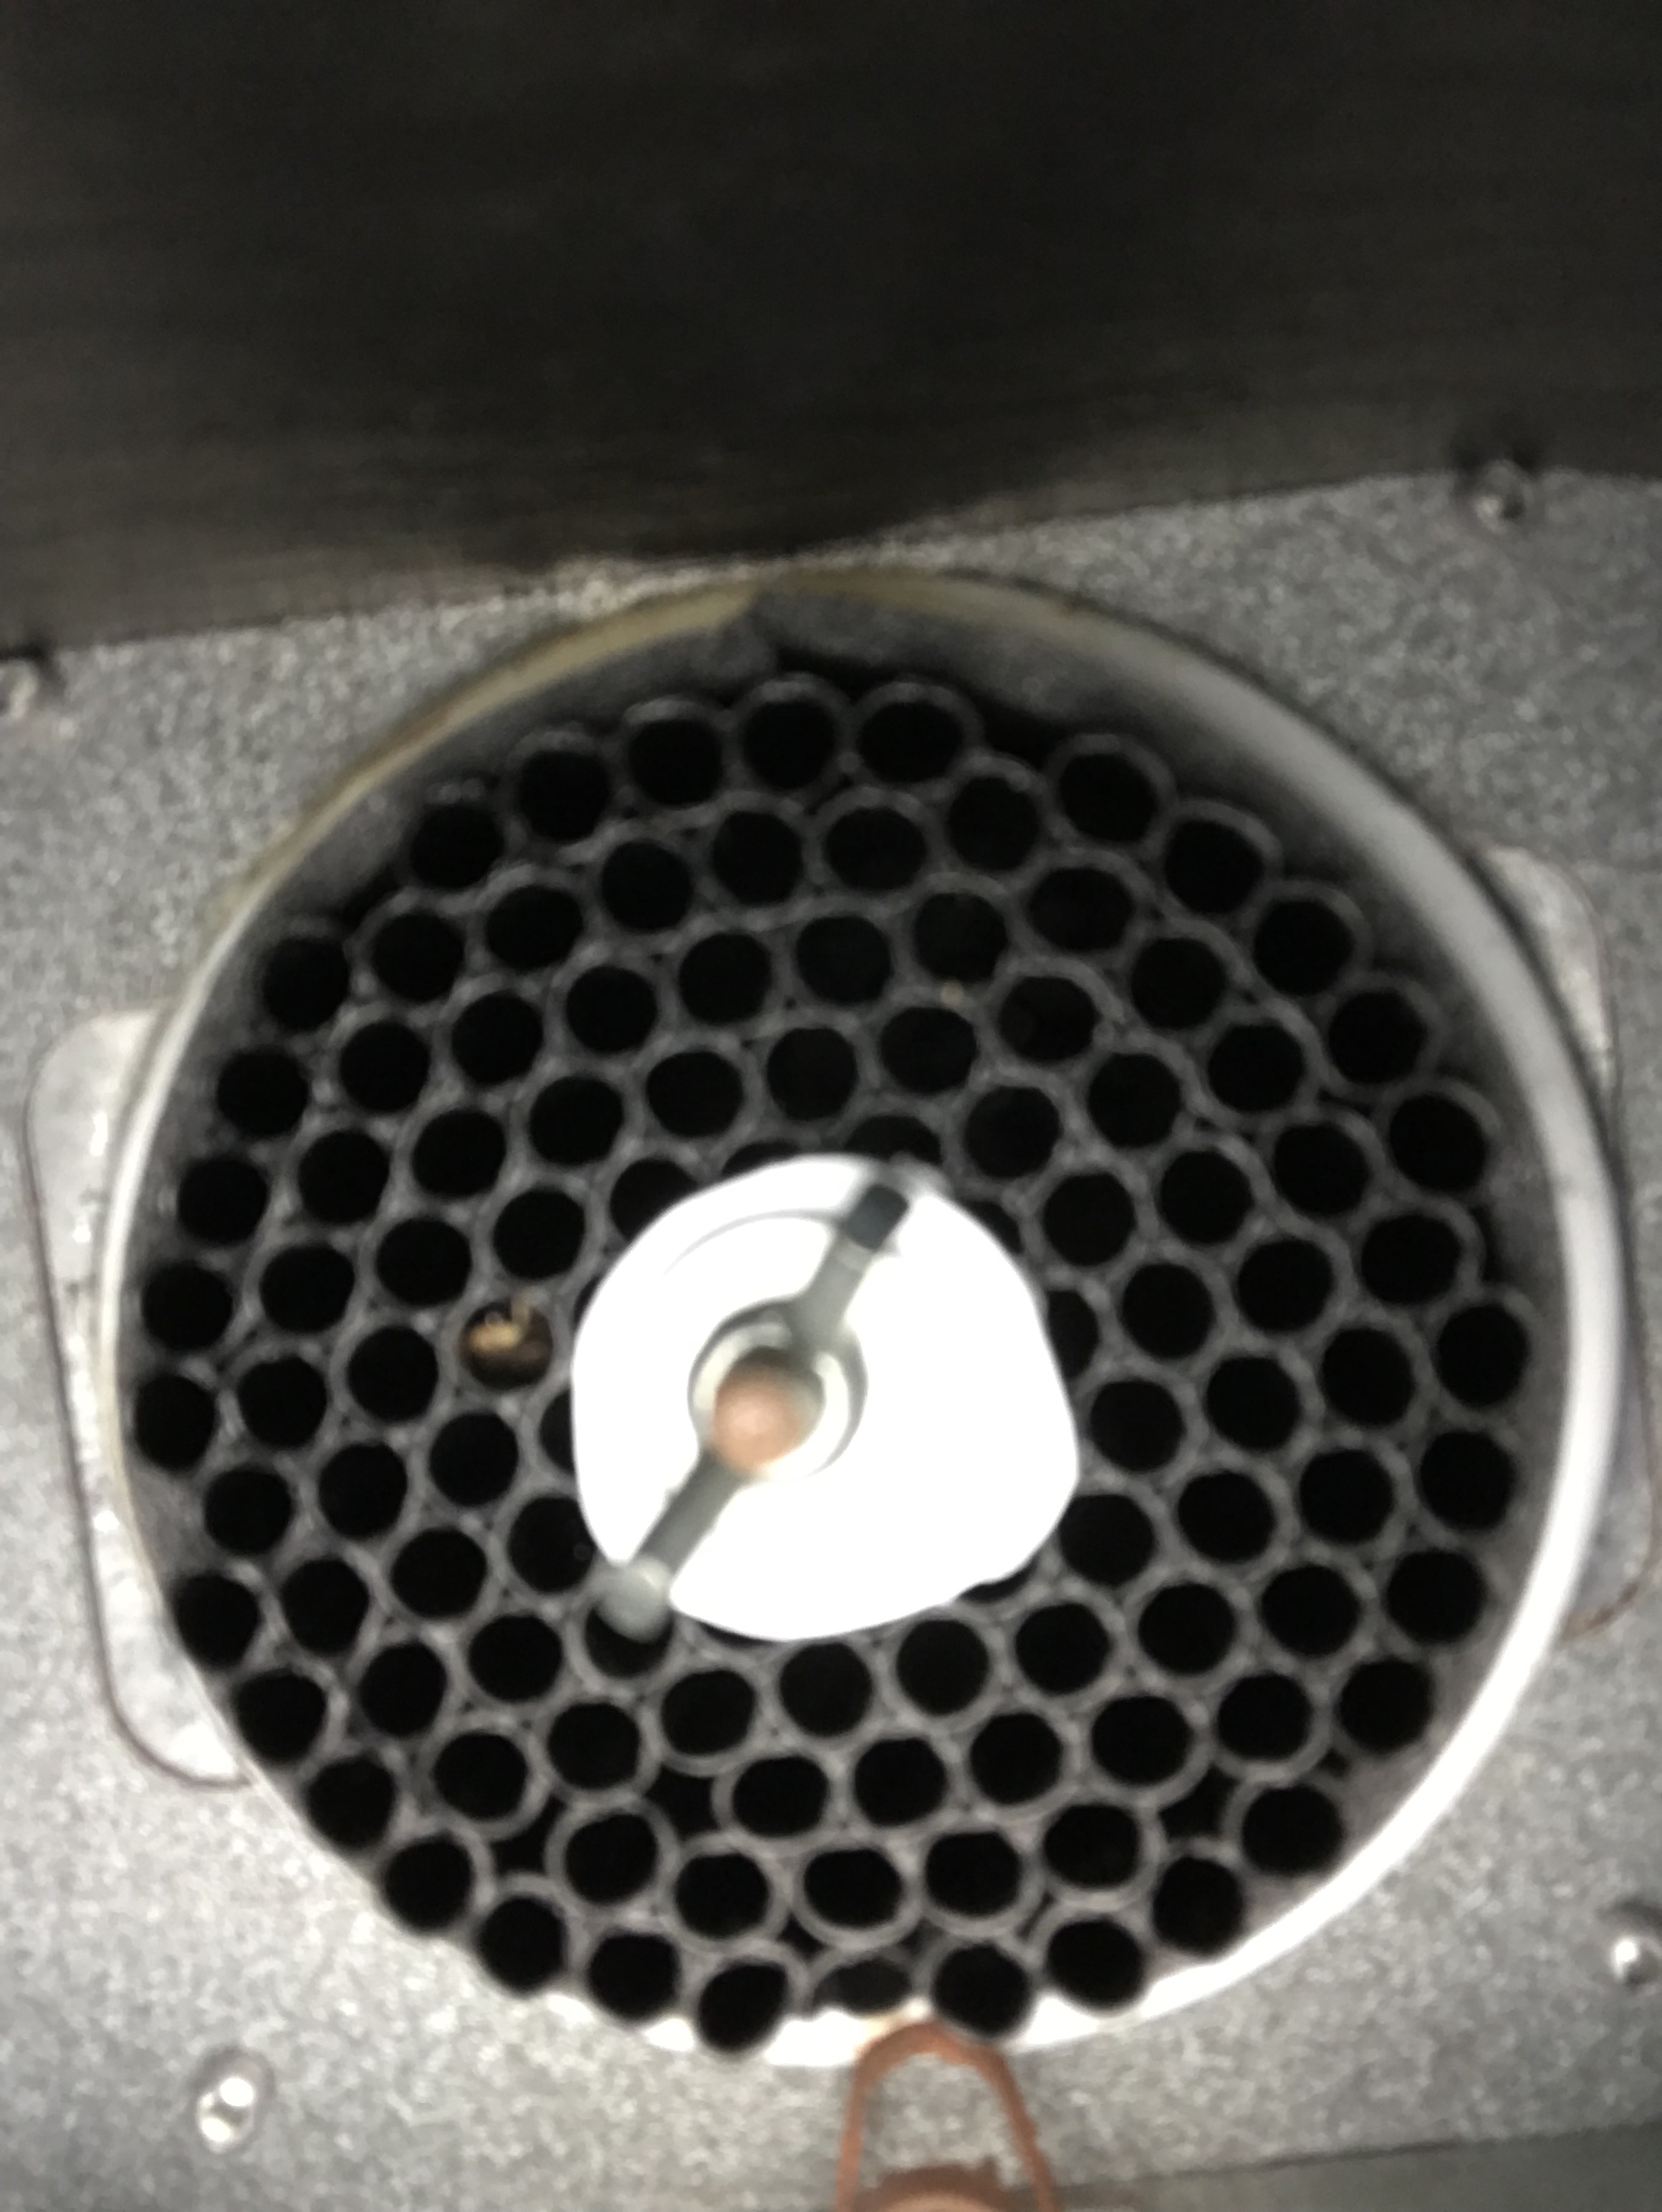
This is what the Return Air diffusers they looked like when I pulled them out, before the adjustment and cleaning:

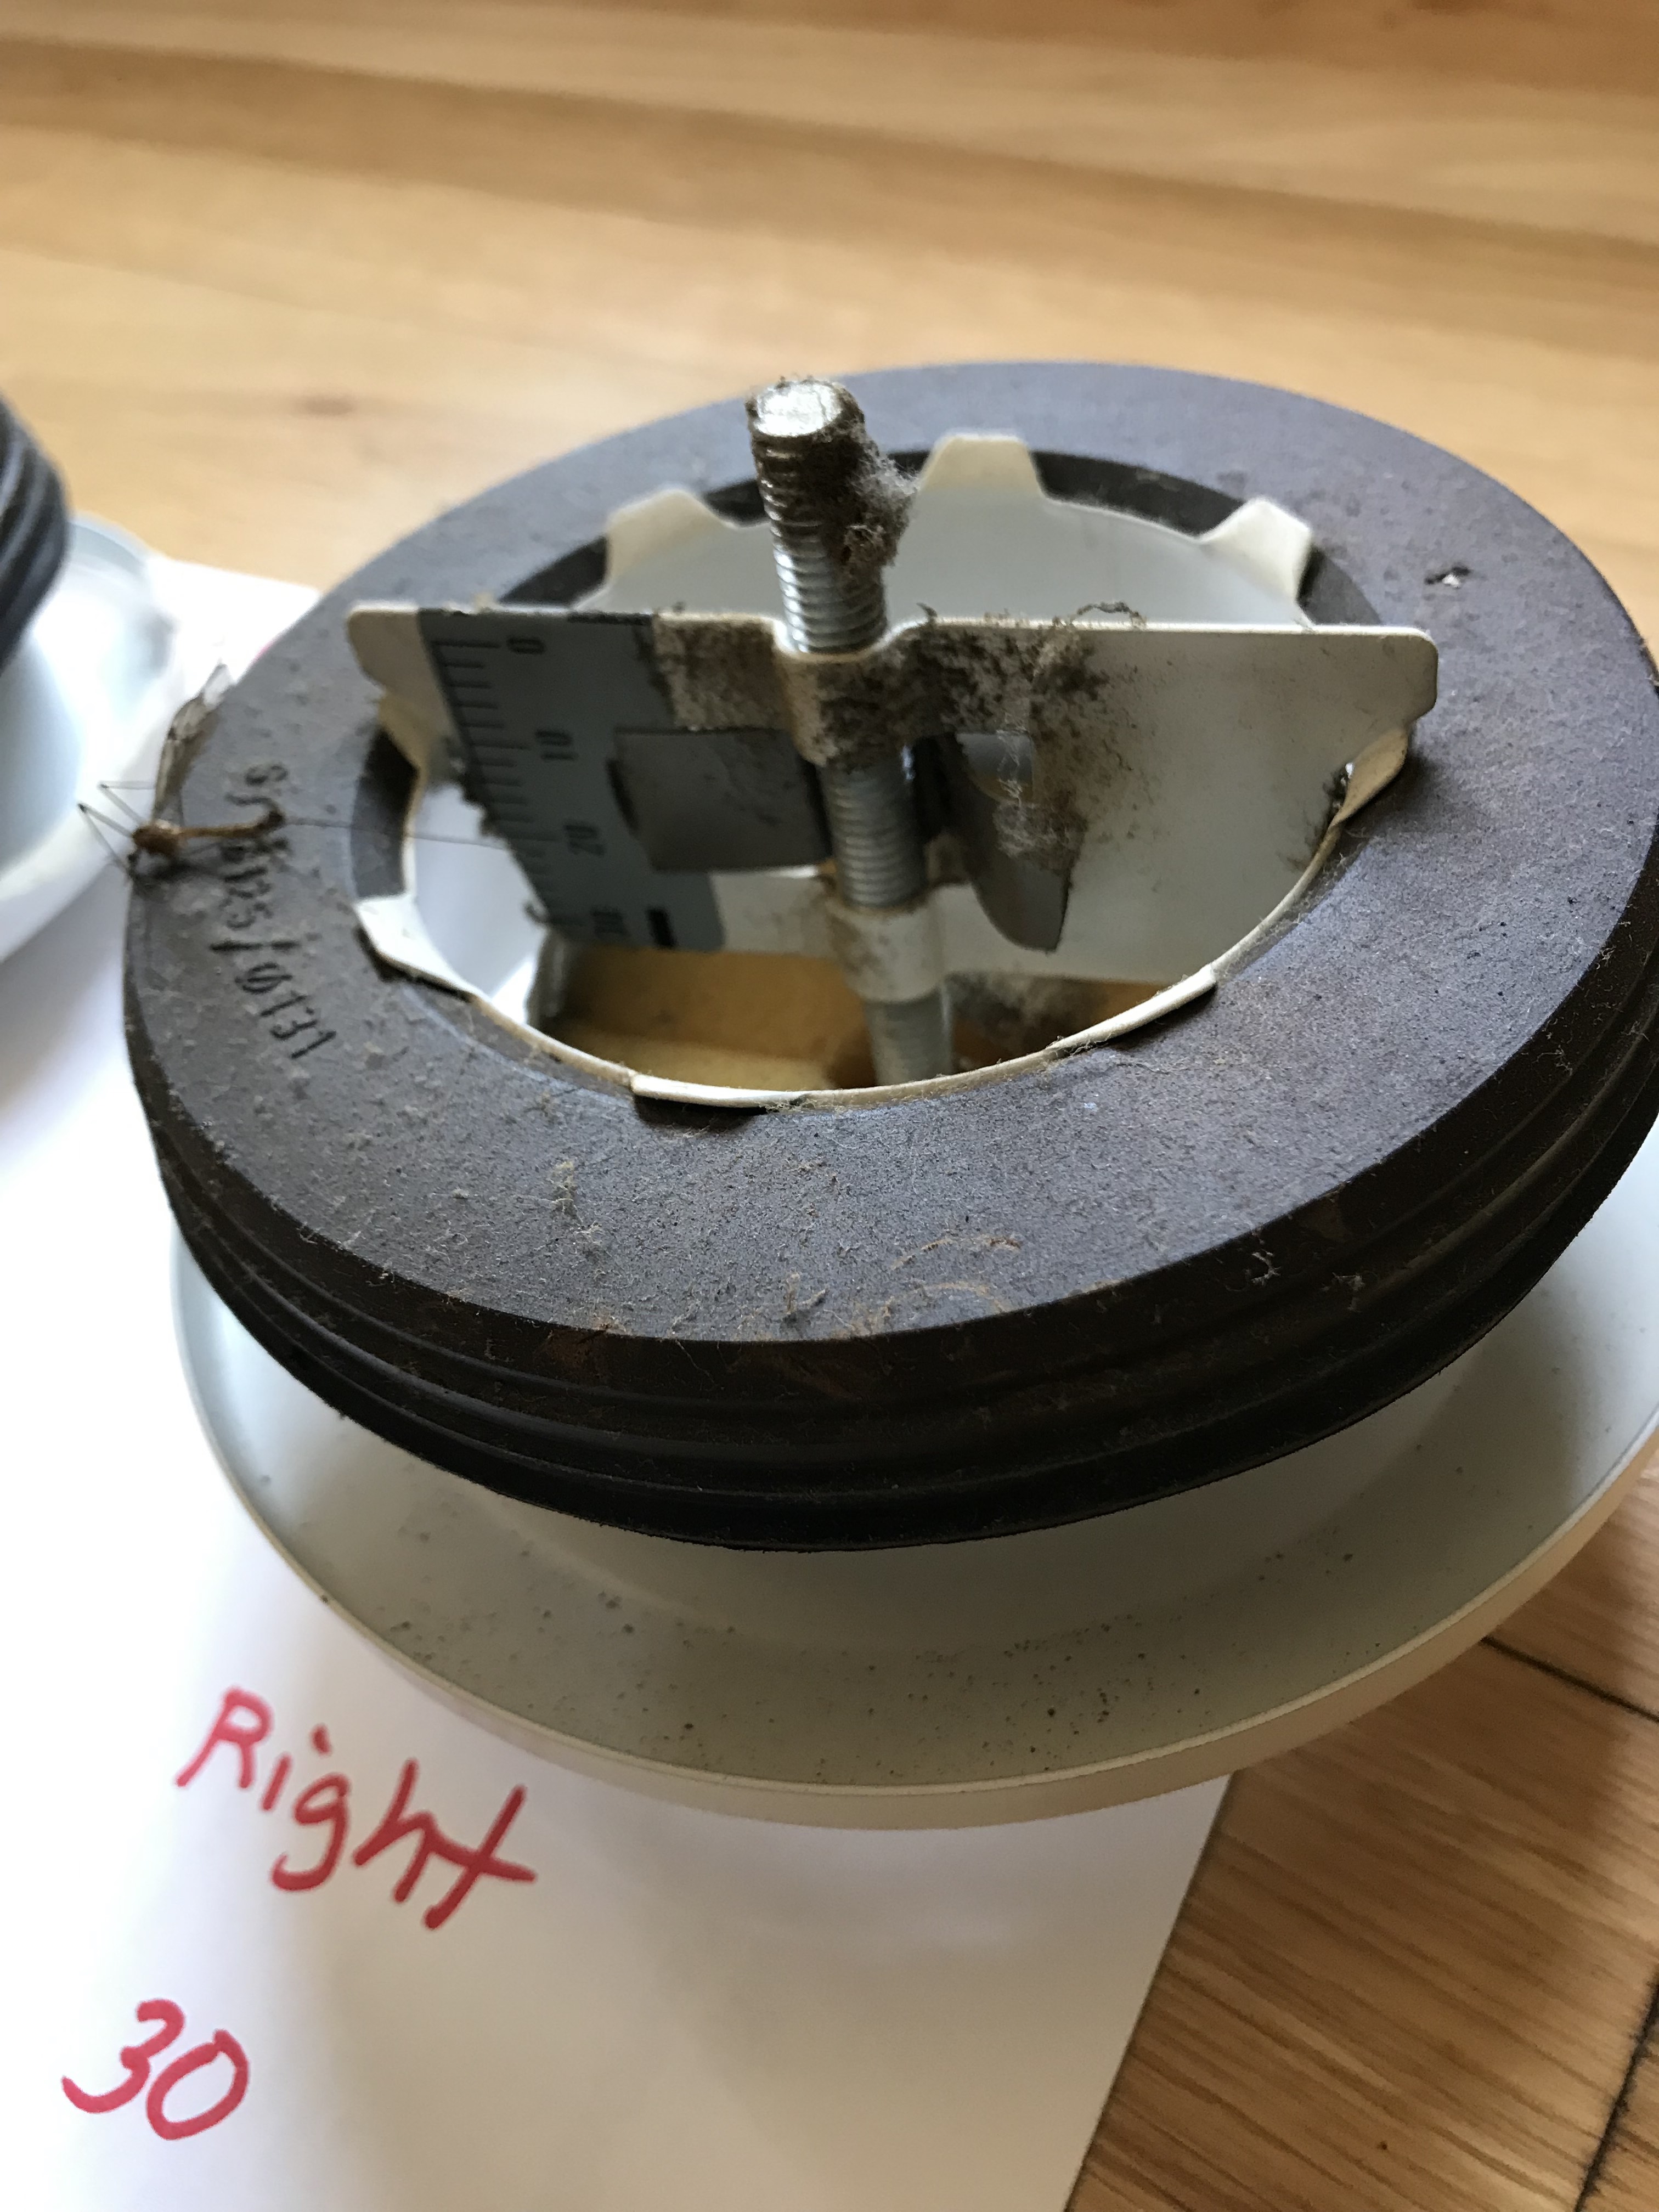
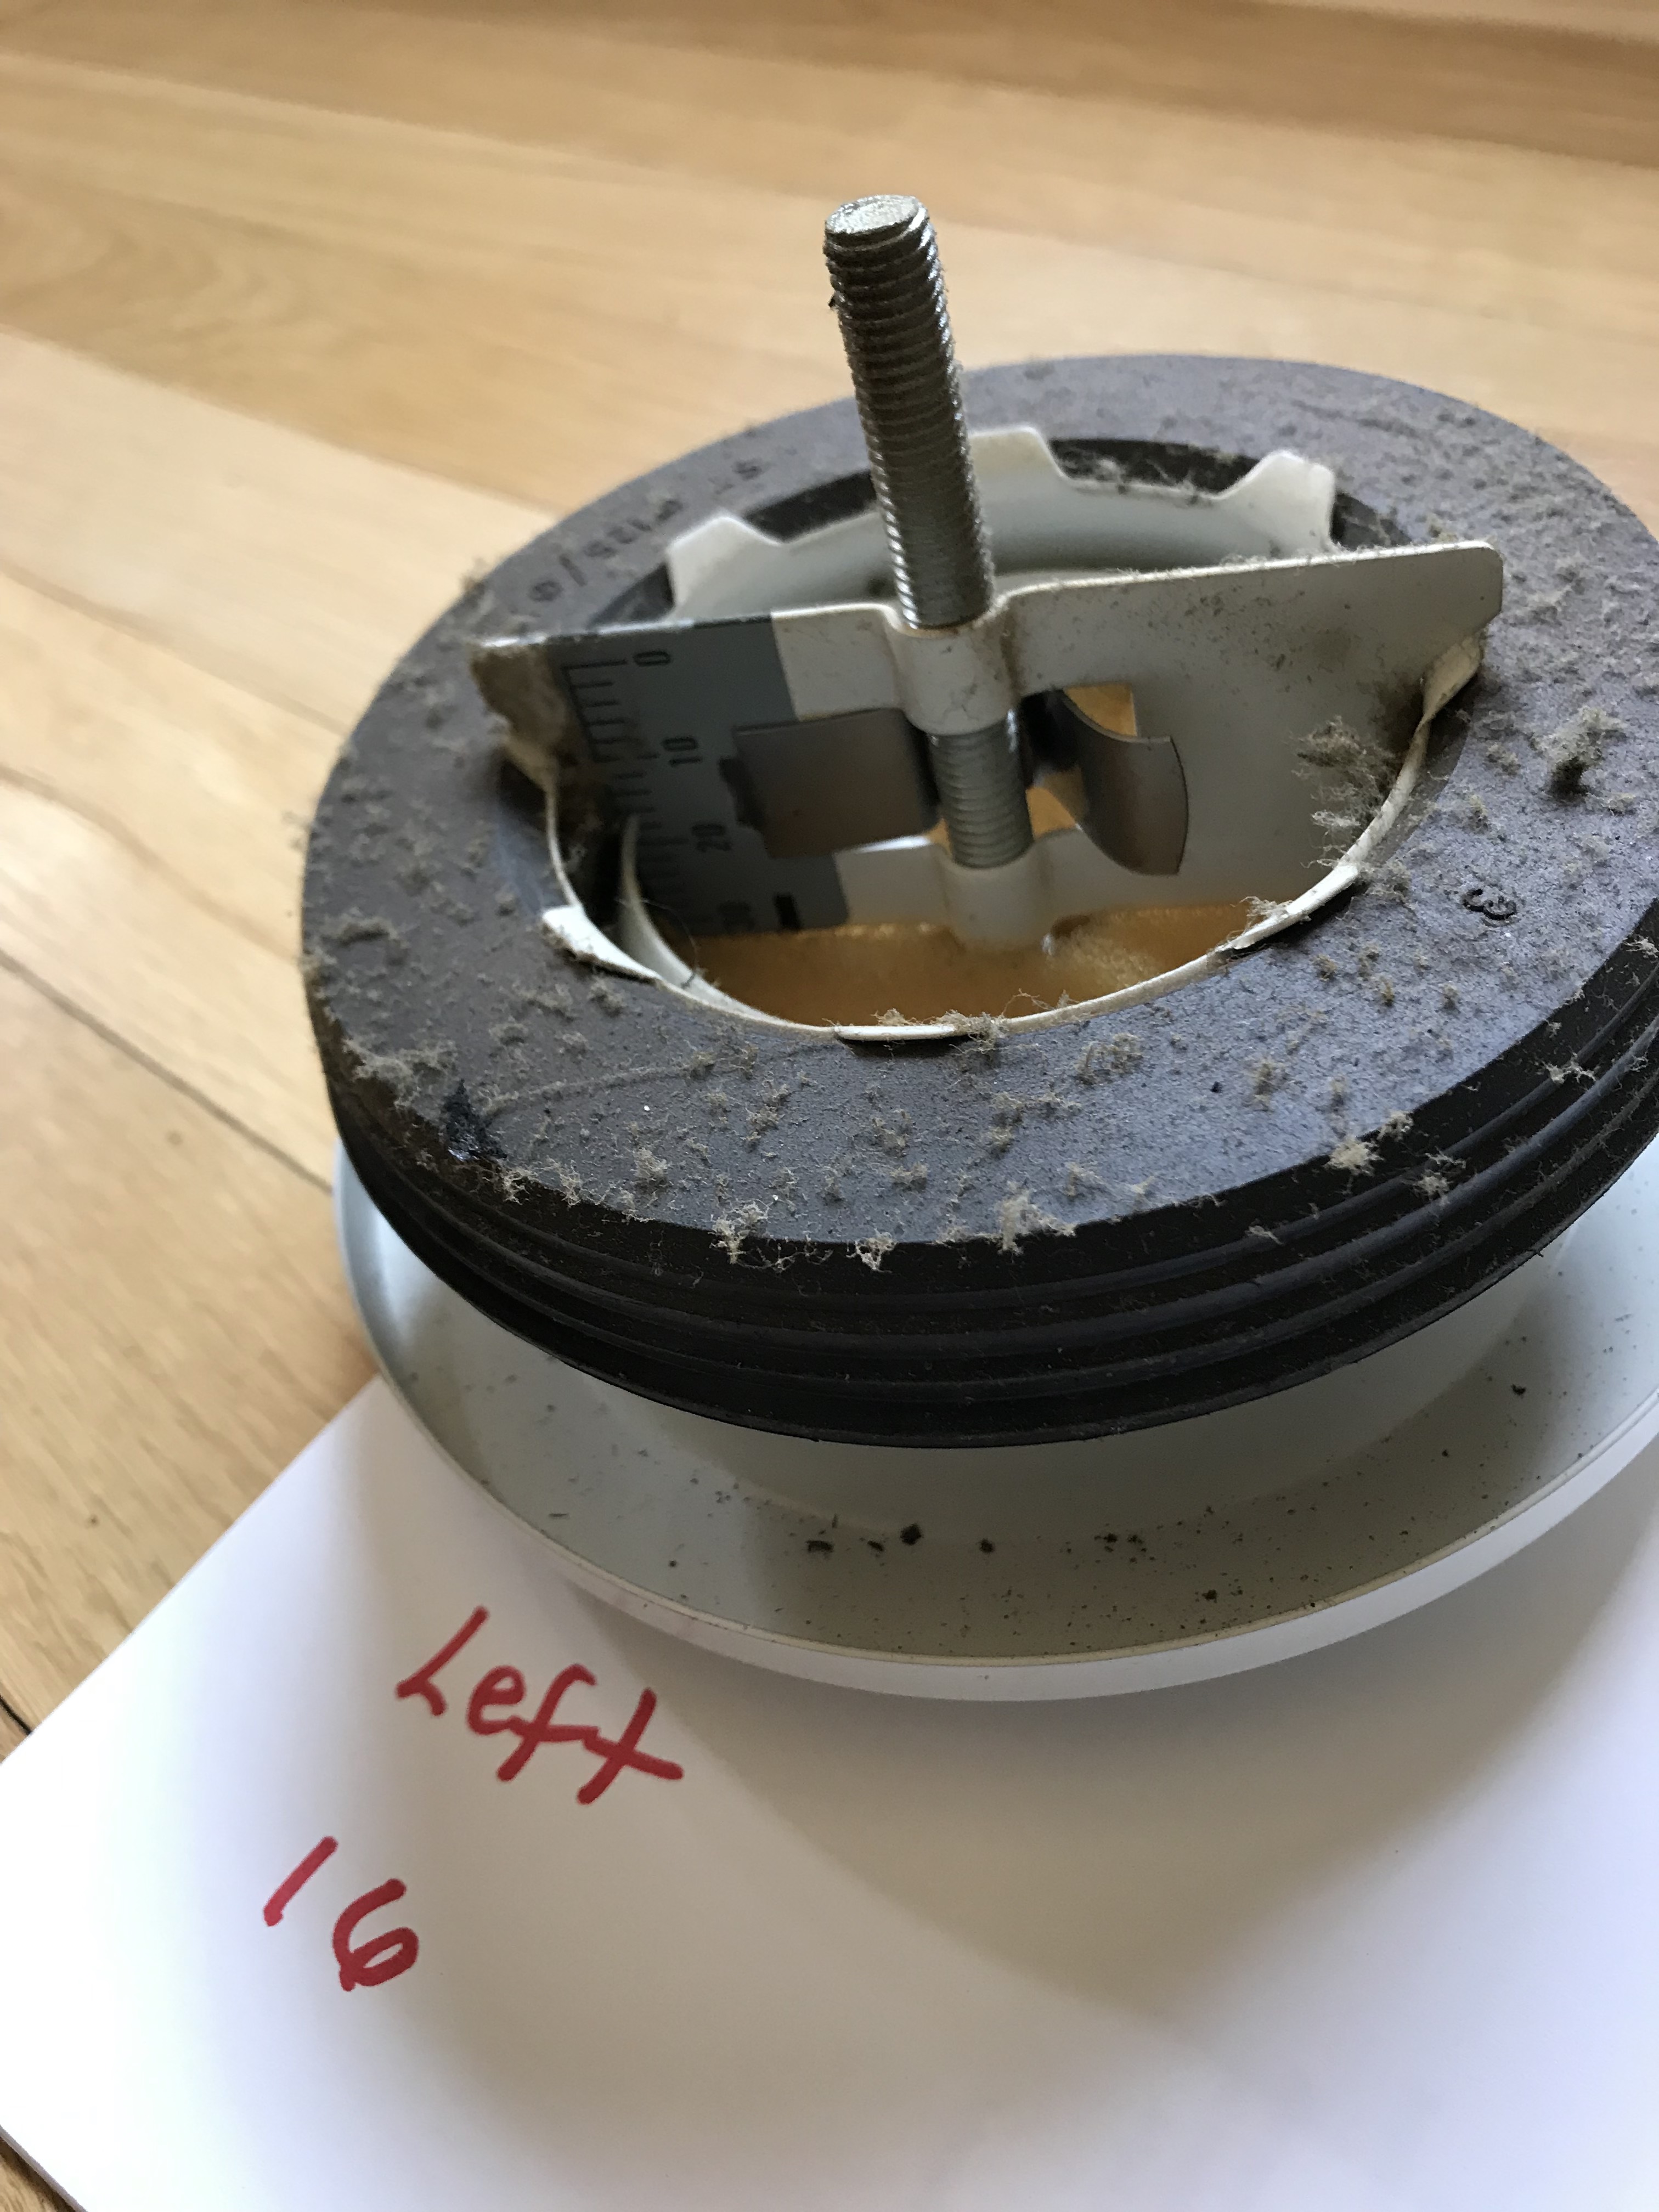
Adjusted the opening size by pressing the tongue and pushing in the inner fitting. The size of the smaller opening in the photo below is 8 on the gauge. This roughly corresponded to the air volume measured (in CFM) at the medium HRV setting.

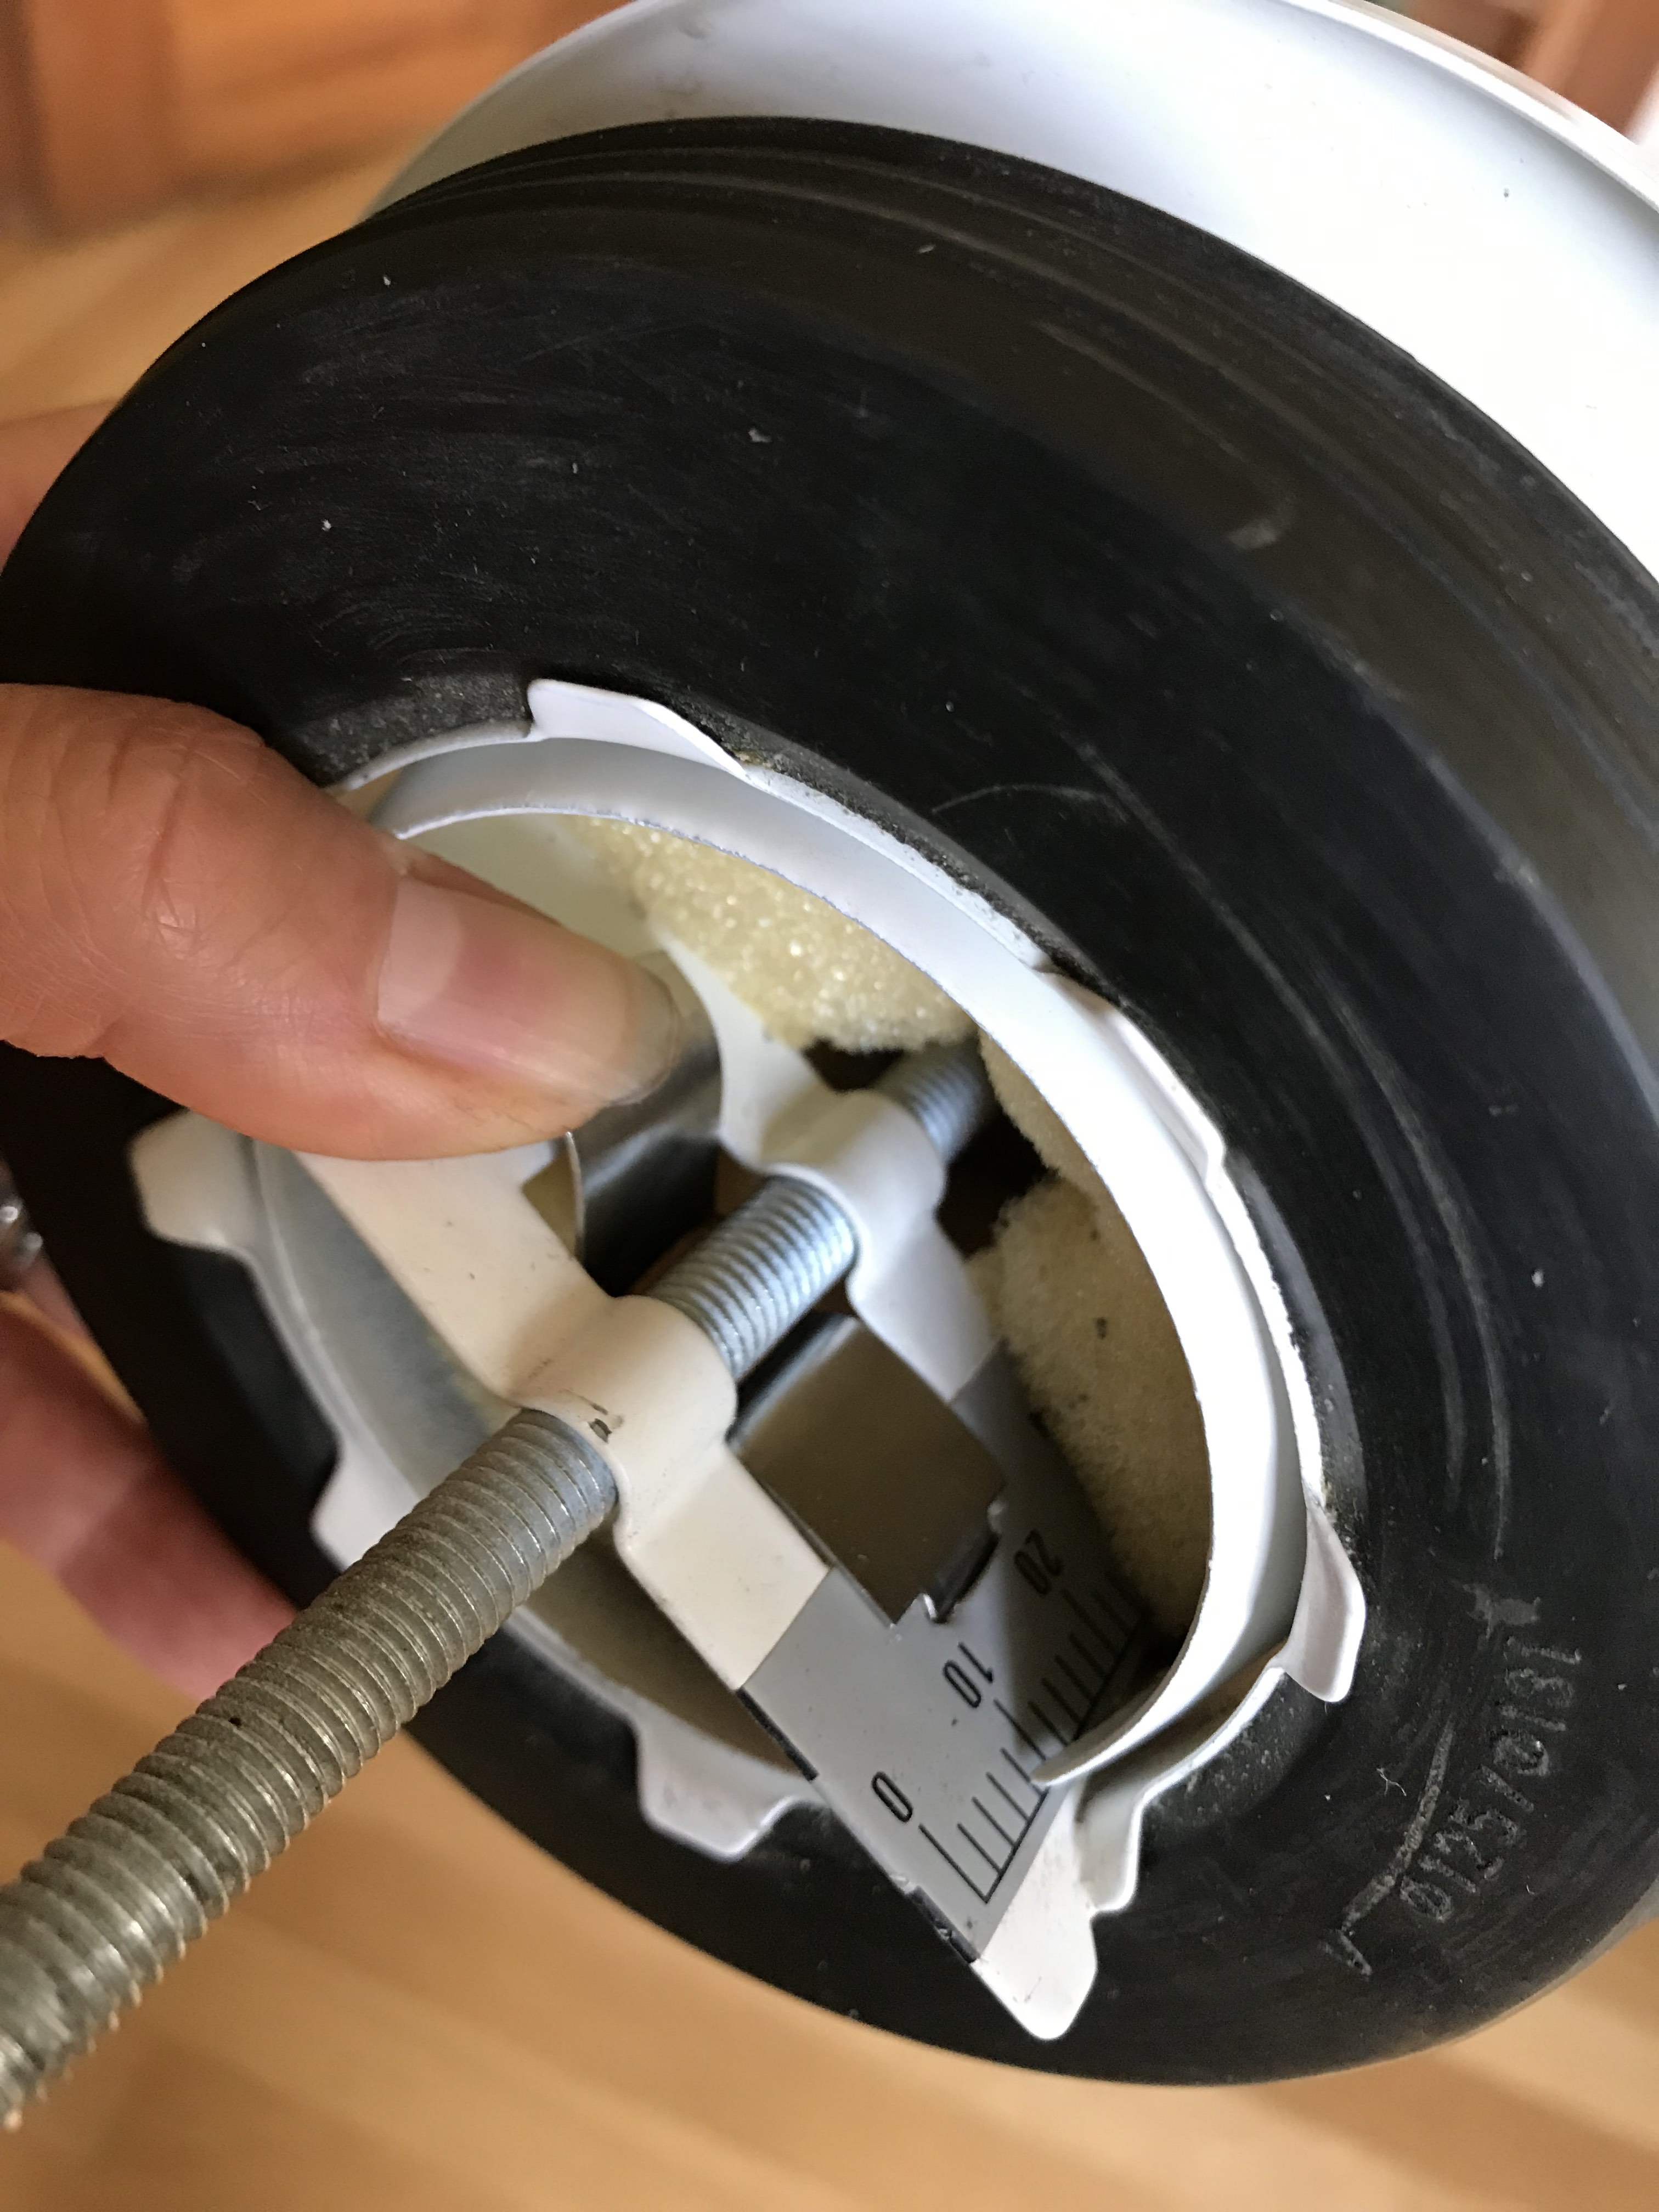
Press down tab and adjust

Adjust Supply Diffuser

I adjusted the supply diffuser in one room to slightly increase the flow. The smallest ring was in place. I removed the ring and cut it smaller. This increased the flow by 2 CFM.

Fresh Air (Supply) Diffuser before adjustment

Fresh Air (Supply) Diffuser After Adjustment

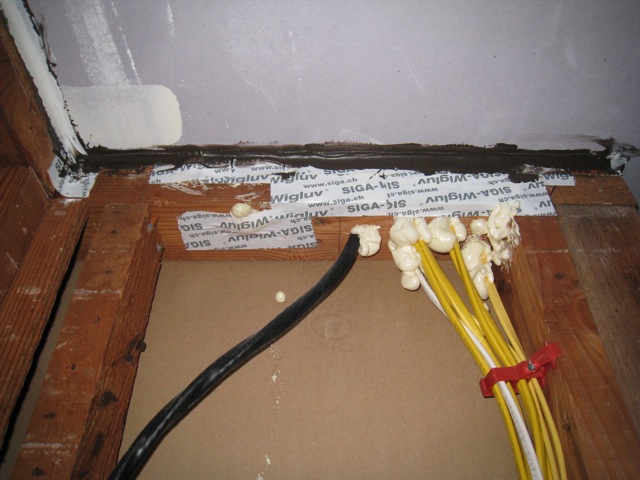
Install Fine Particle Filter

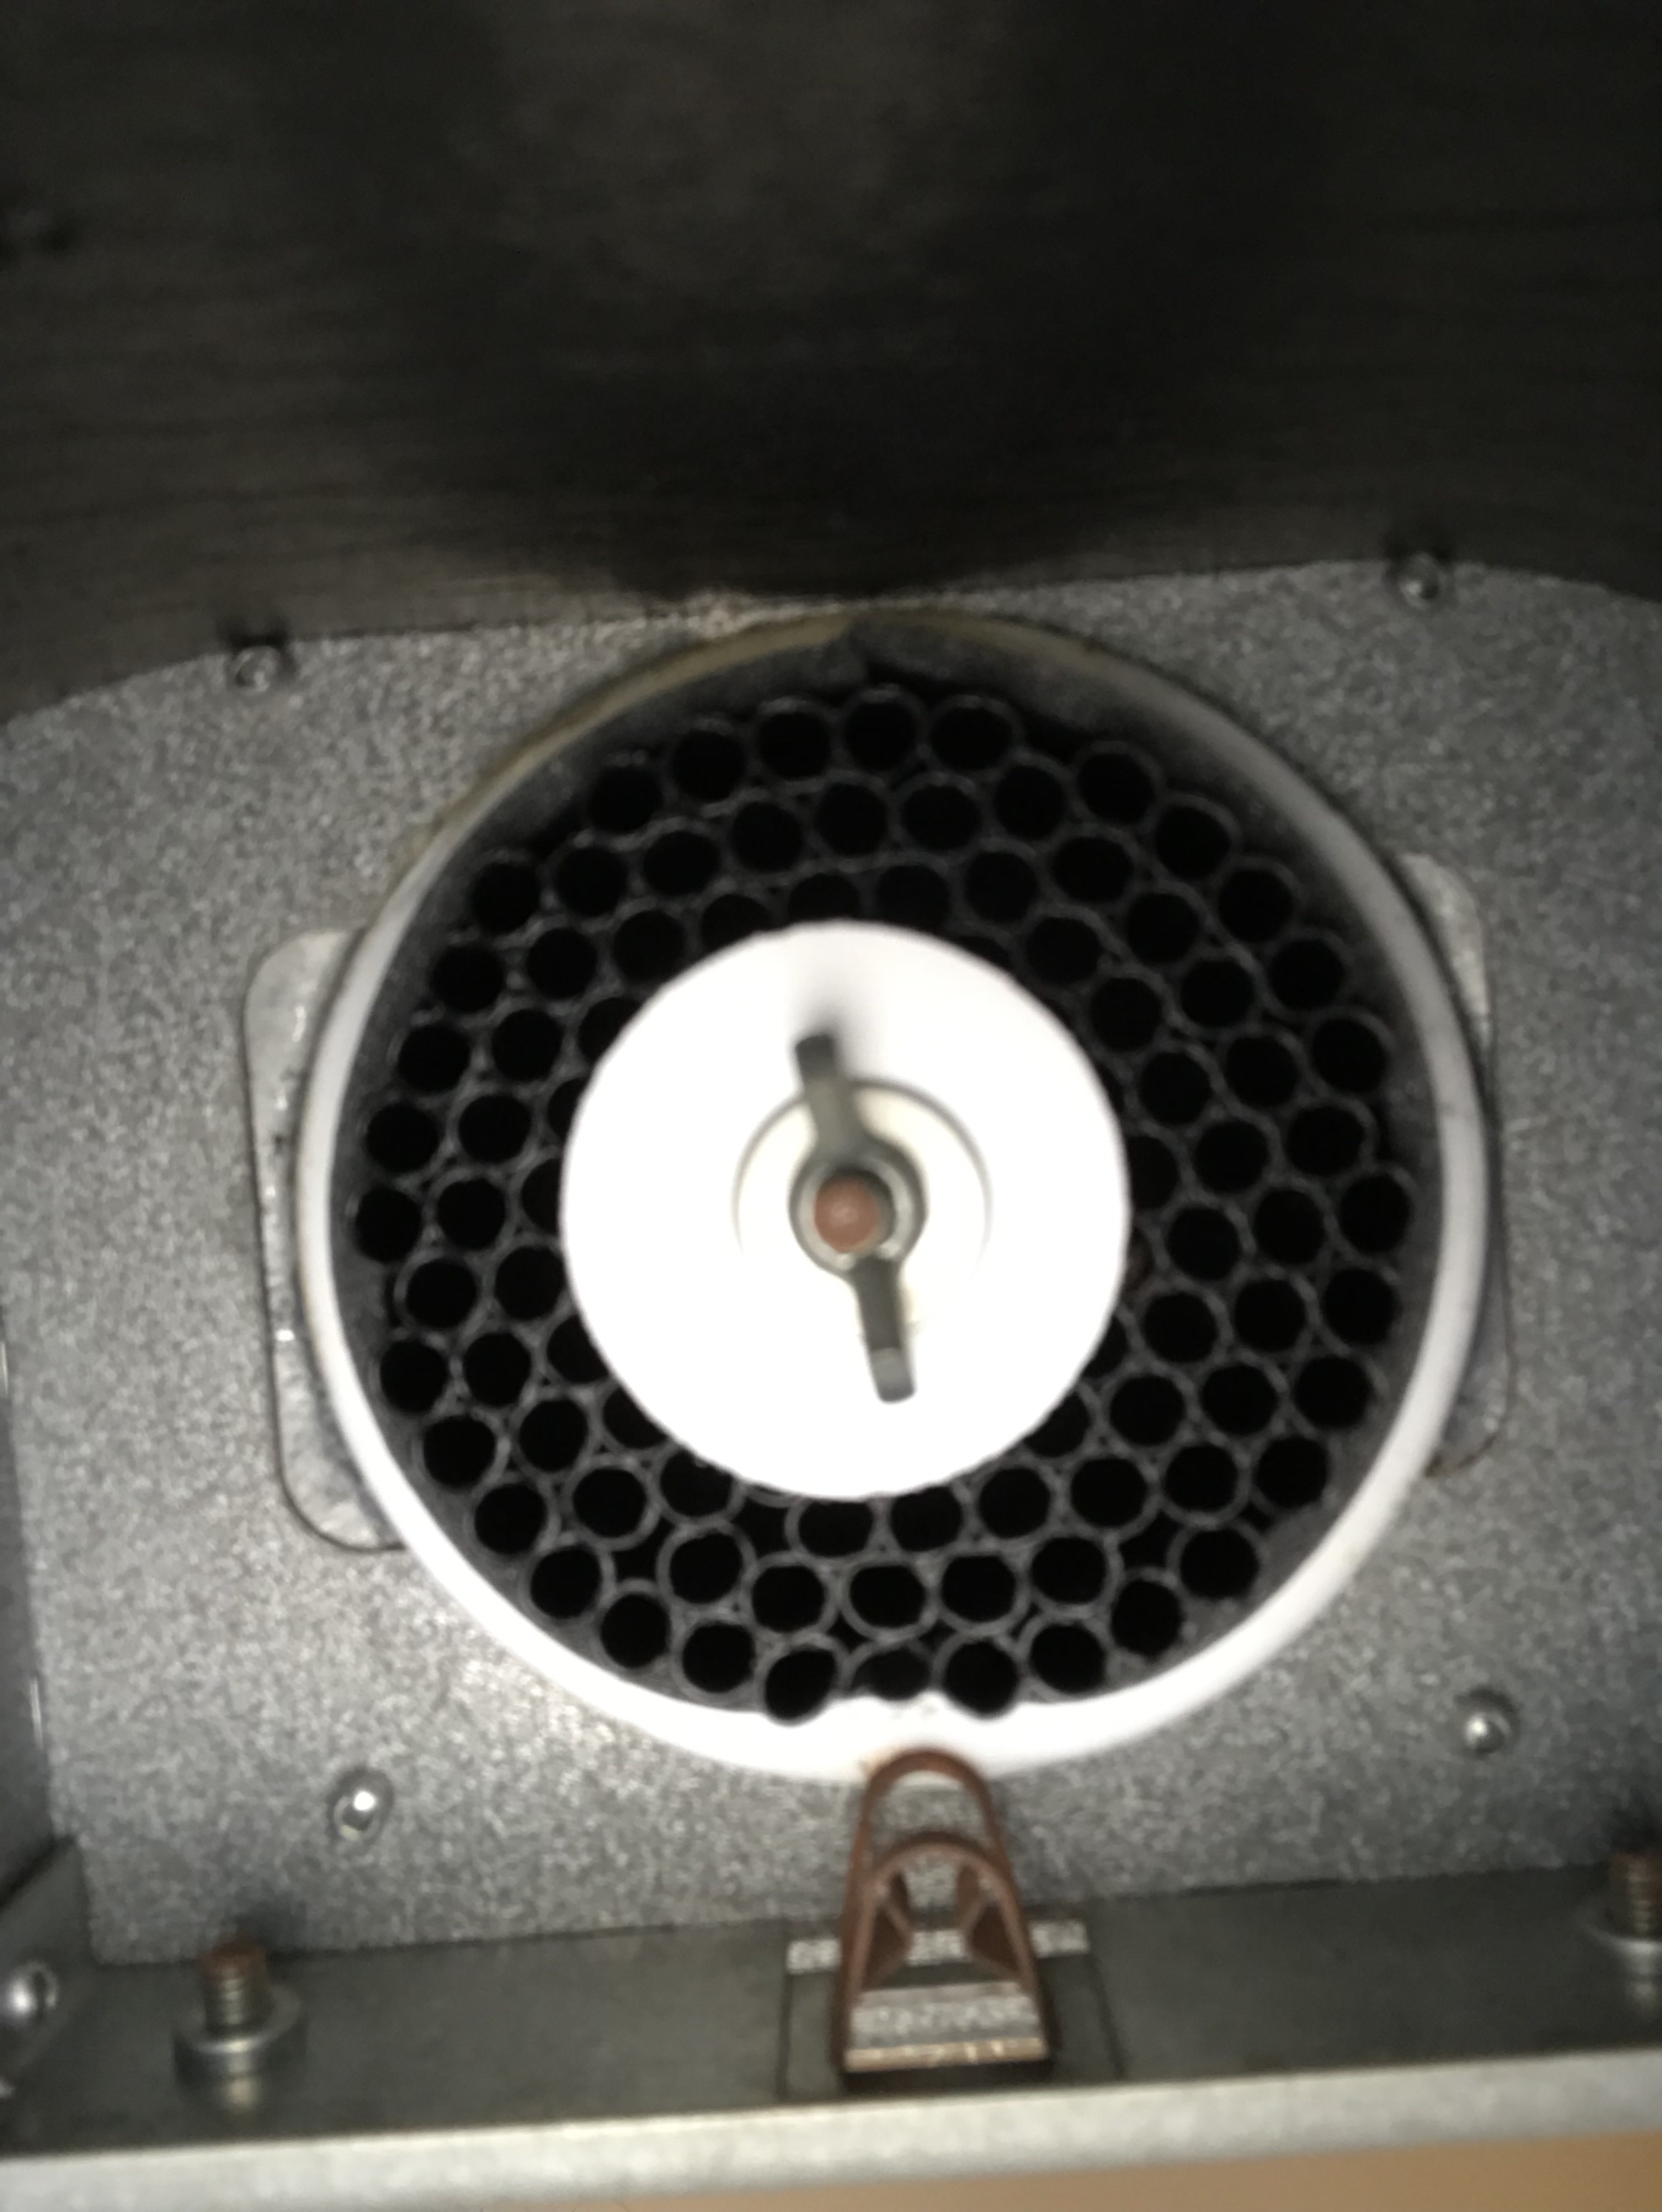
Next phase of this project required climbing into the attic to Install the yellow particle filter (MERV 15) in the ComfoWell, upstream of the activated carbon filter. While I was in there, I replaced the activated carbon filter. We’ve been calling this “charcoal filter” and can’t get ourselves to call it by the correct name.

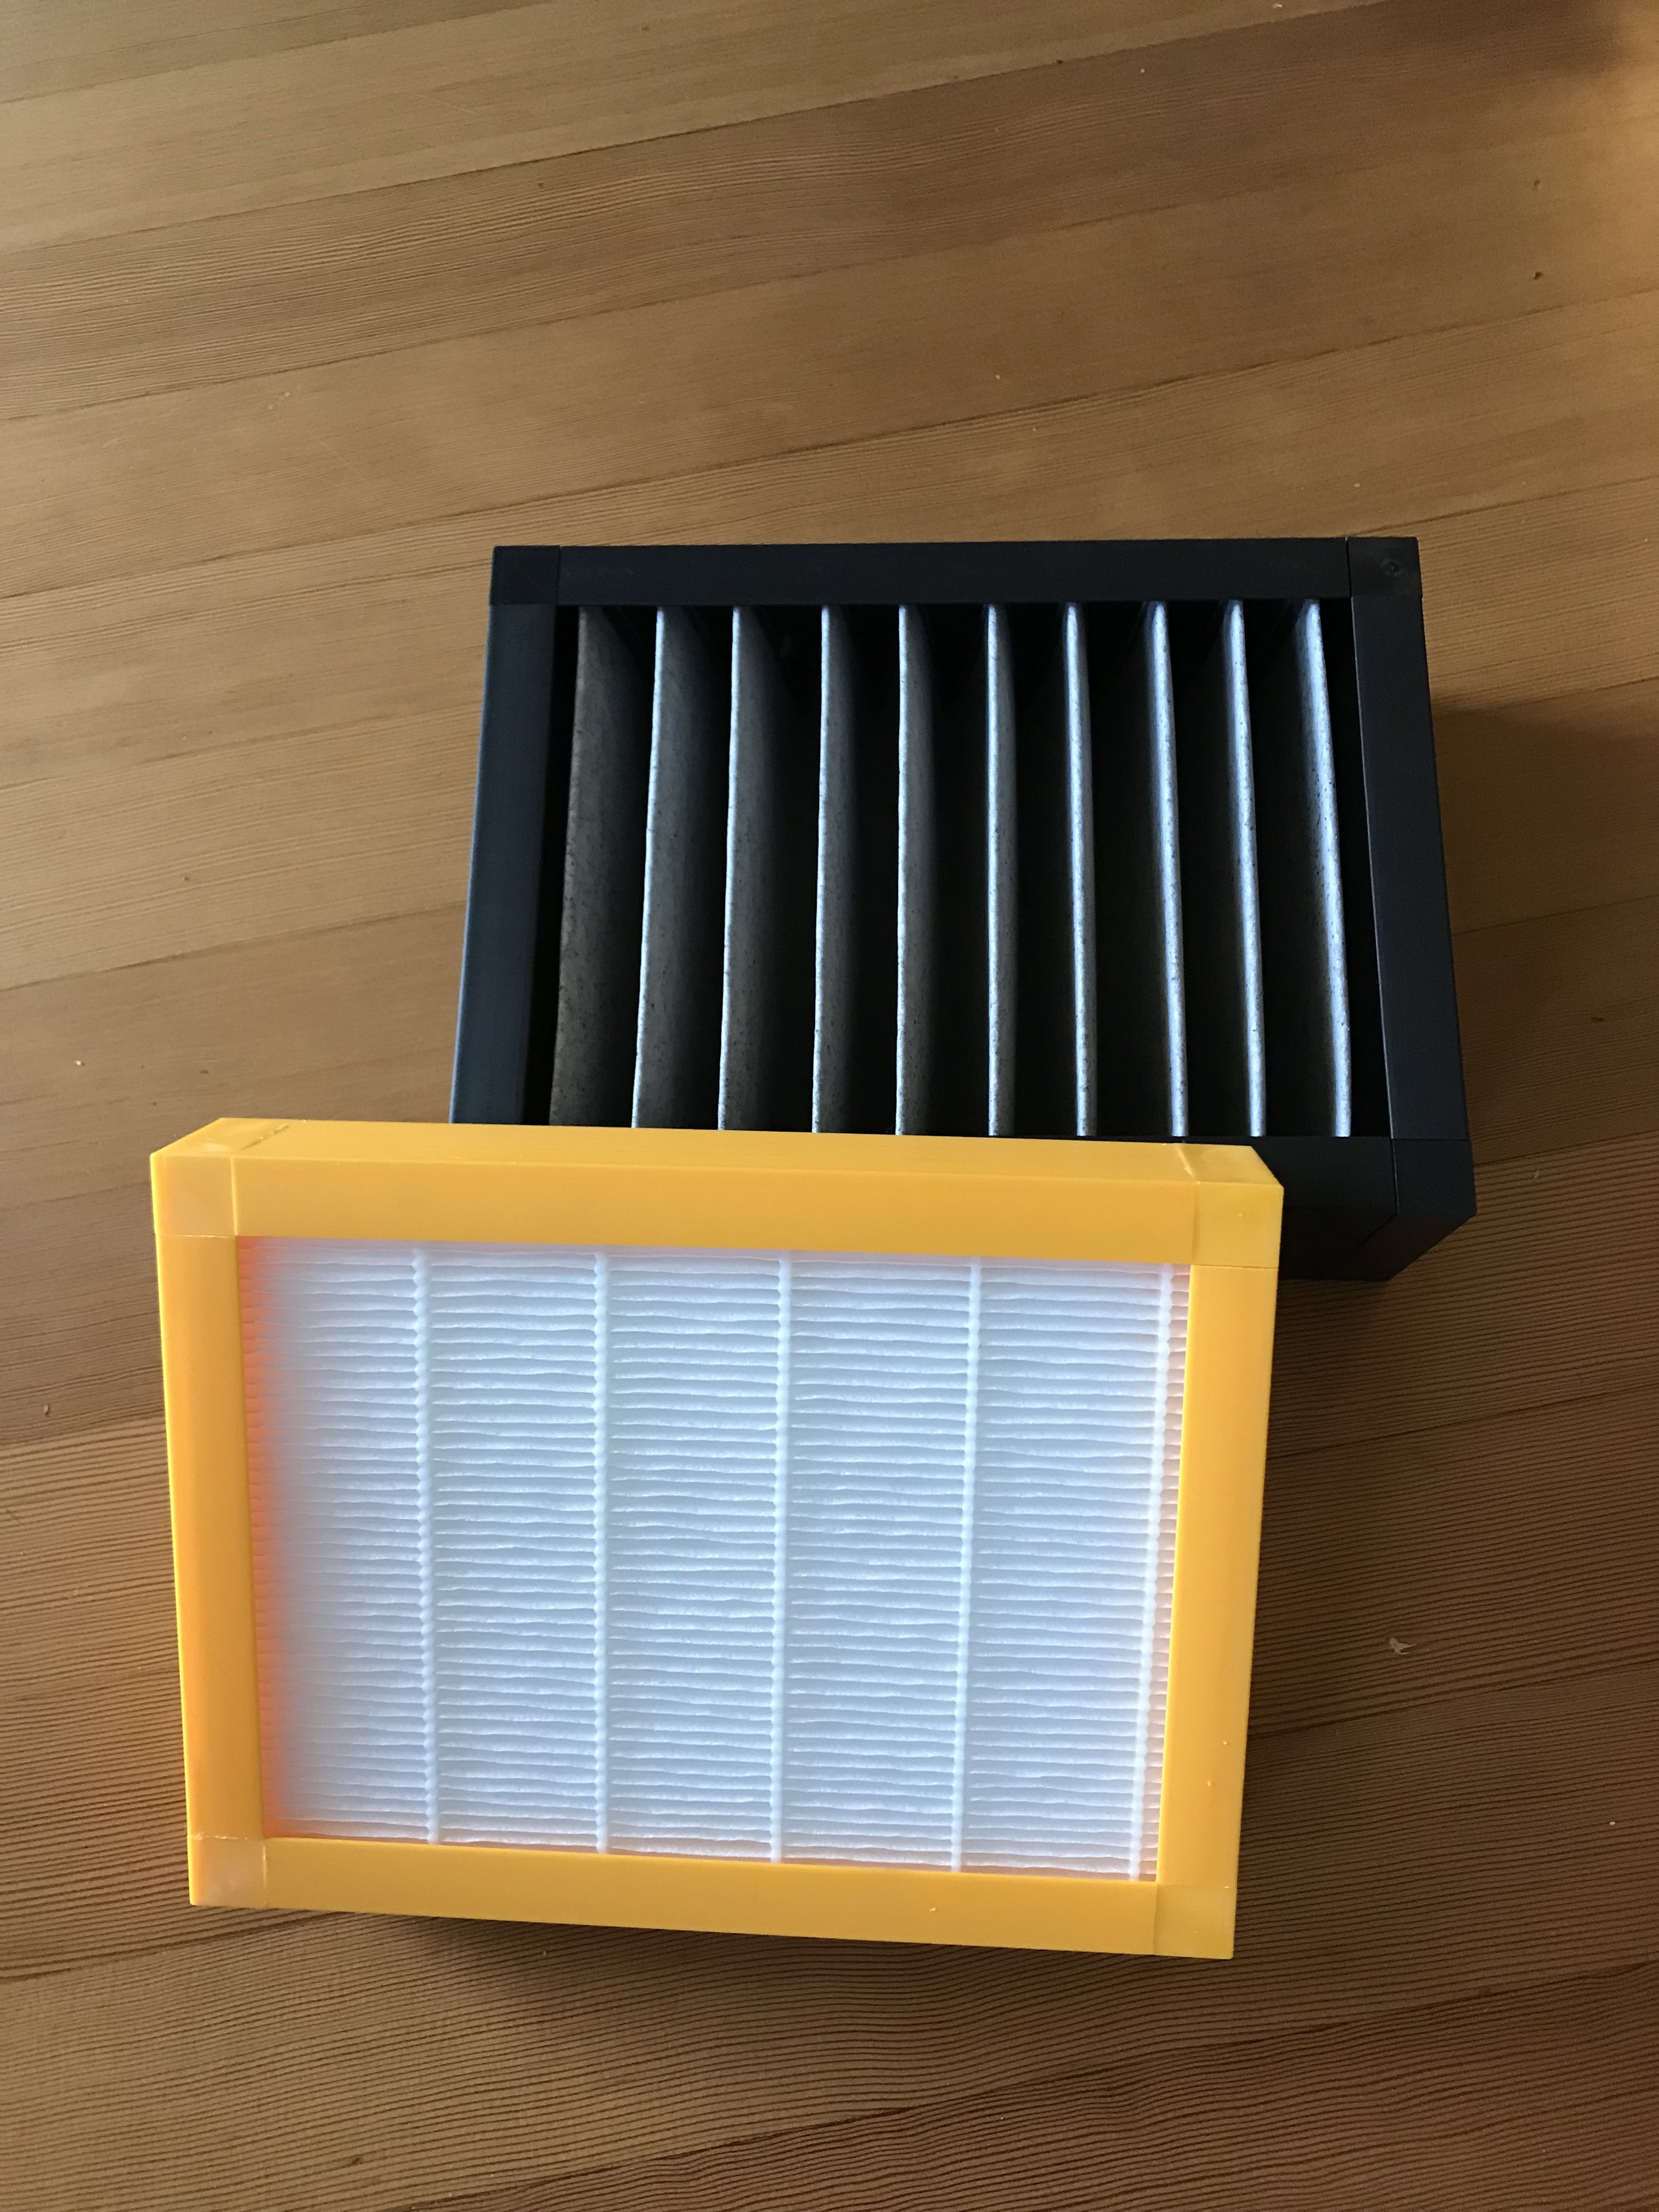
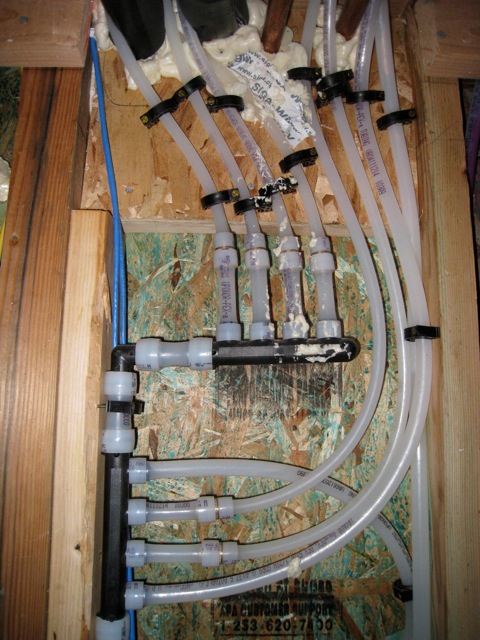
Fine Particle Filter and Activated Carbon Filter

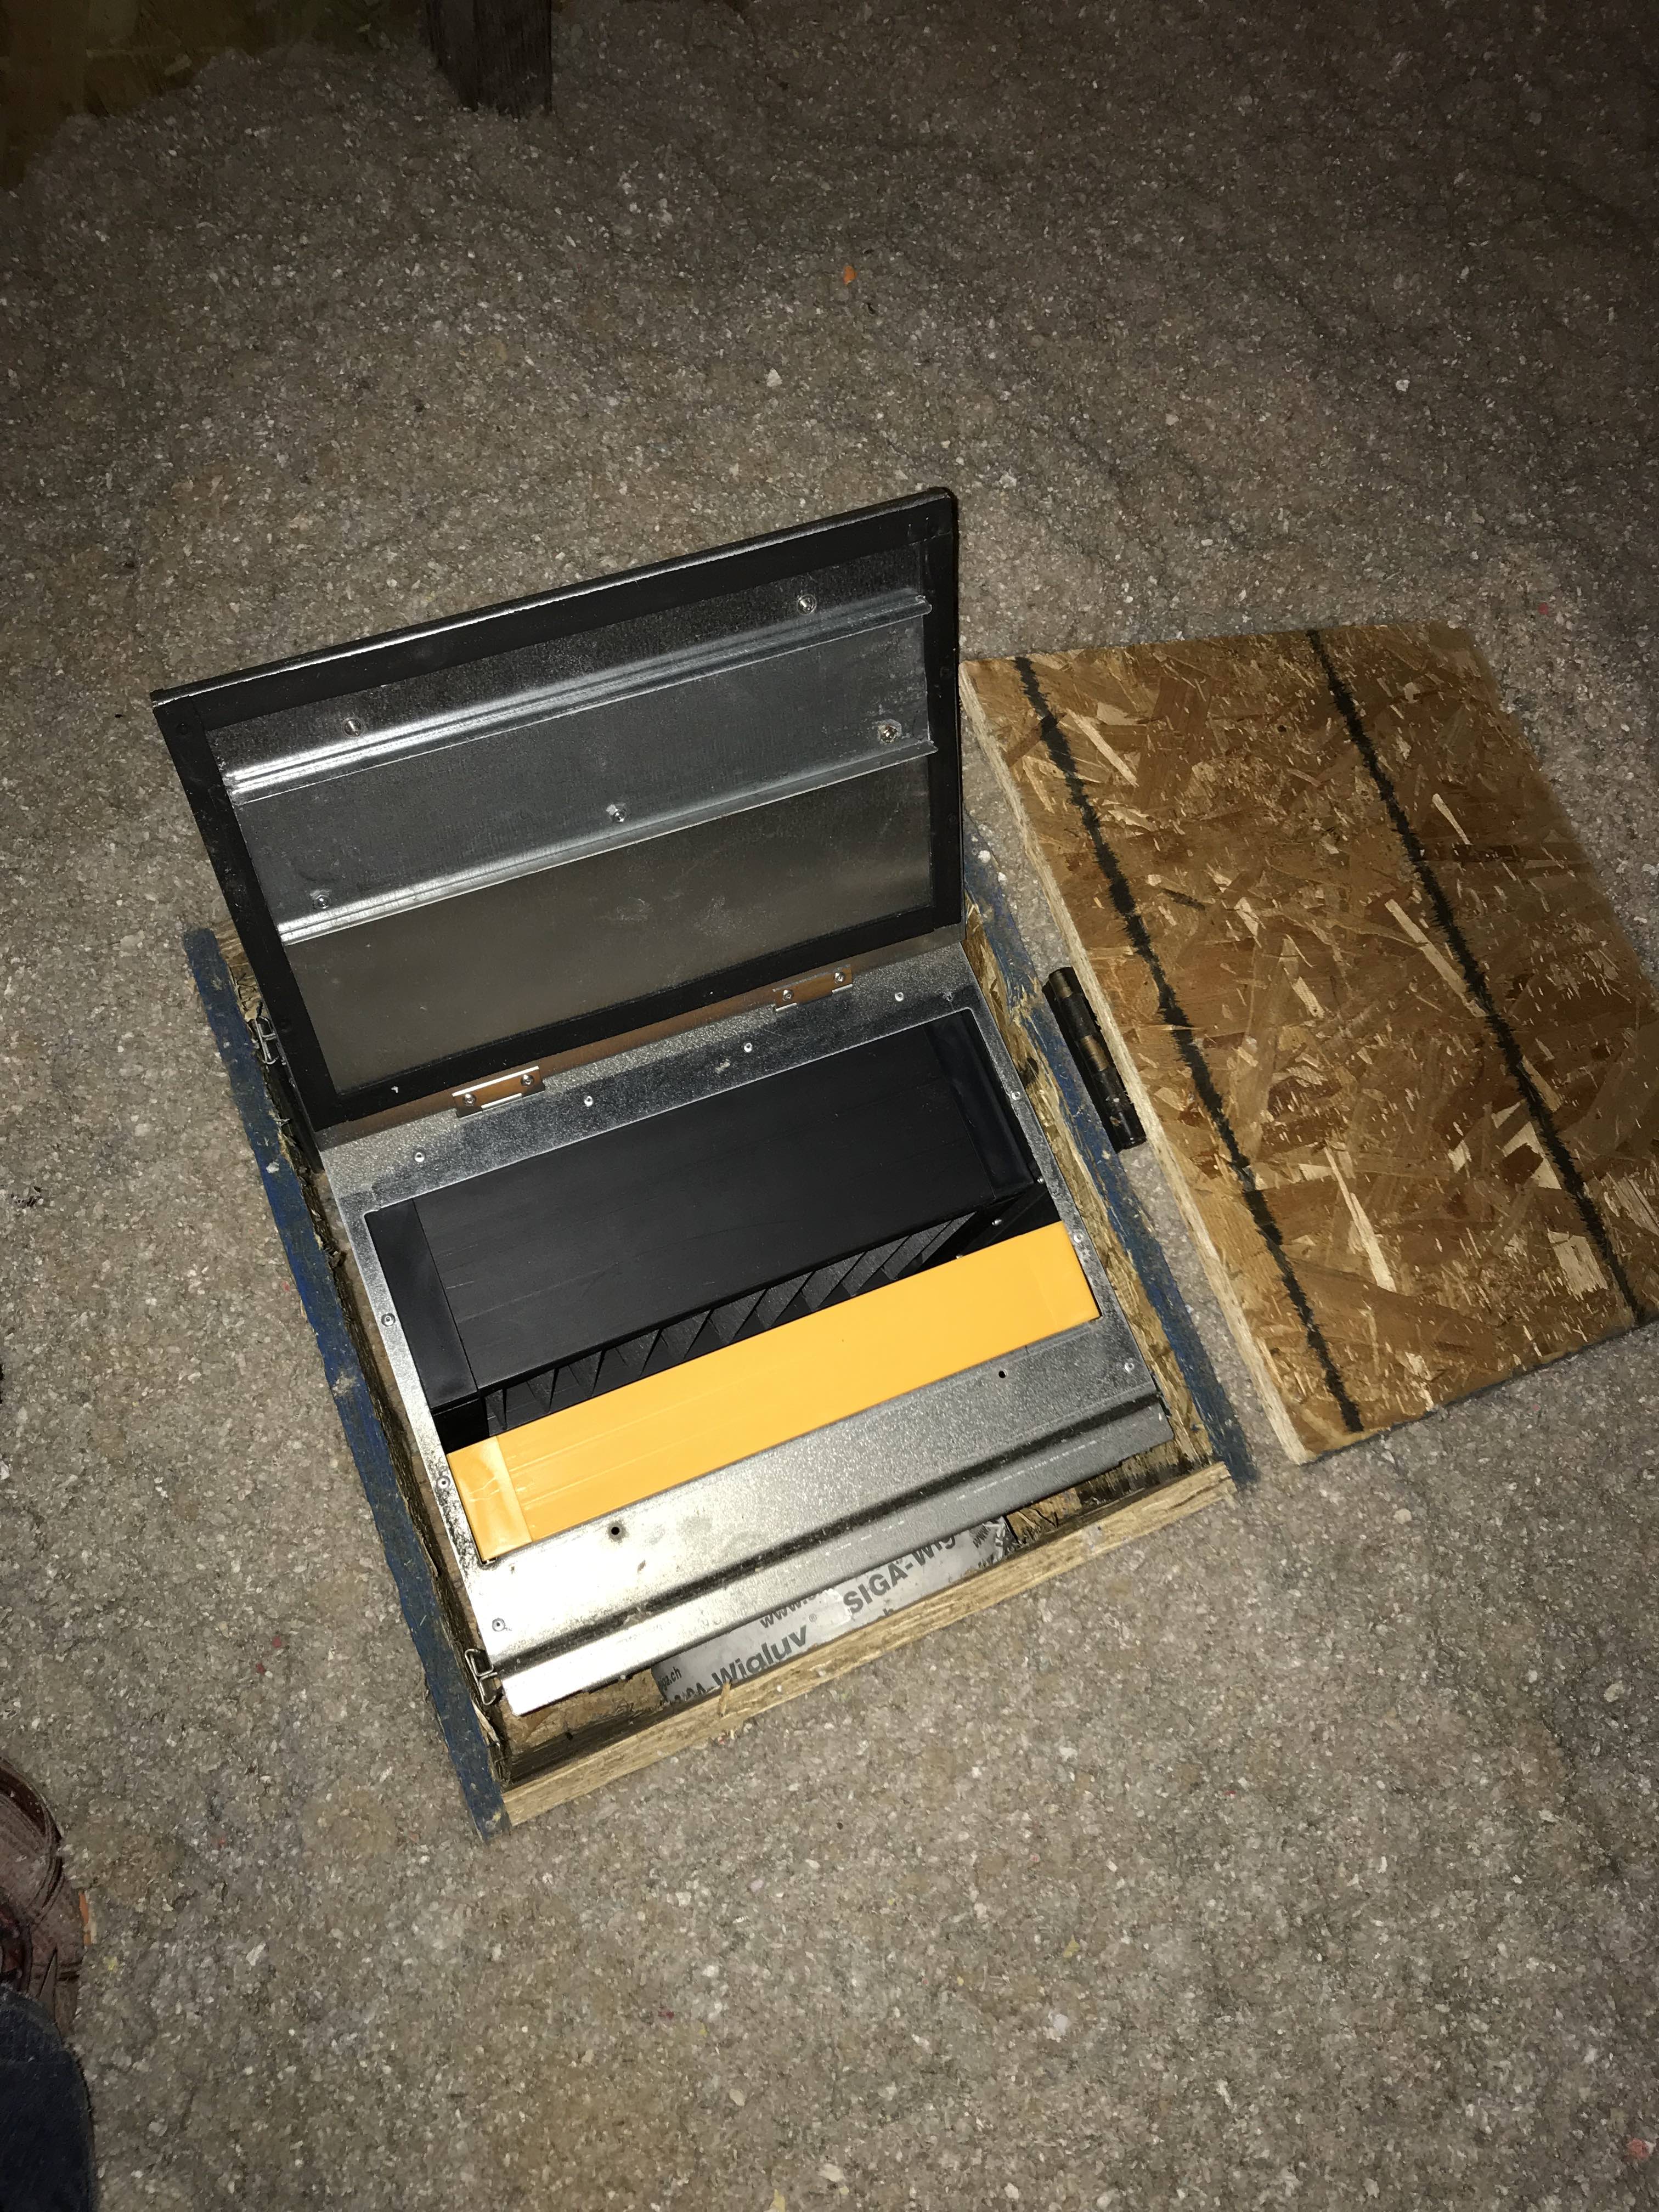
ComfoWell with Activated Charcoal Filter and Fine Particle Filter

Adjust Fan Setting Values

The total fresh air (supply) measurement dropped by about 3 CFM after the installation of the additional yellow particle filter. The total return air (exhaust) measurement was still about 20 CFM greater than the total fresh air (supply) measurement at medium fan setting. Next step was to adjust the fan speed.

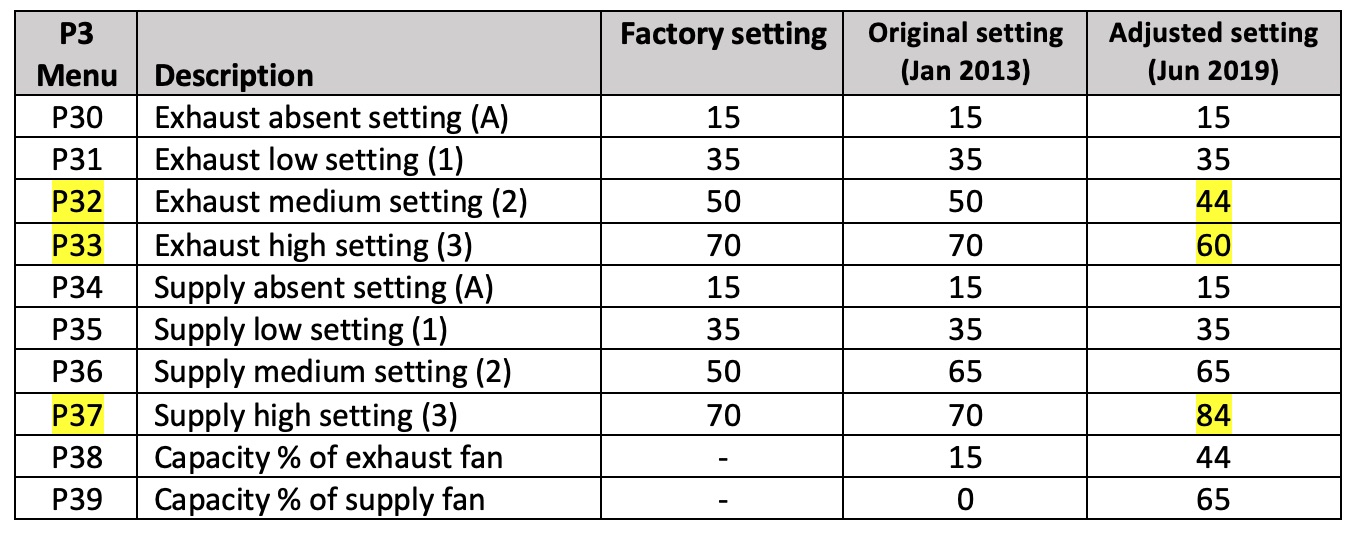
I followed the instruction on page 9 of Zehnder Installation Manualto access P3 (ventilation program) menu. I lowered the fan values for exhaust medium setting (P32) and exhaust high setting (P33). I raised the fan value for supply high setting (P37).

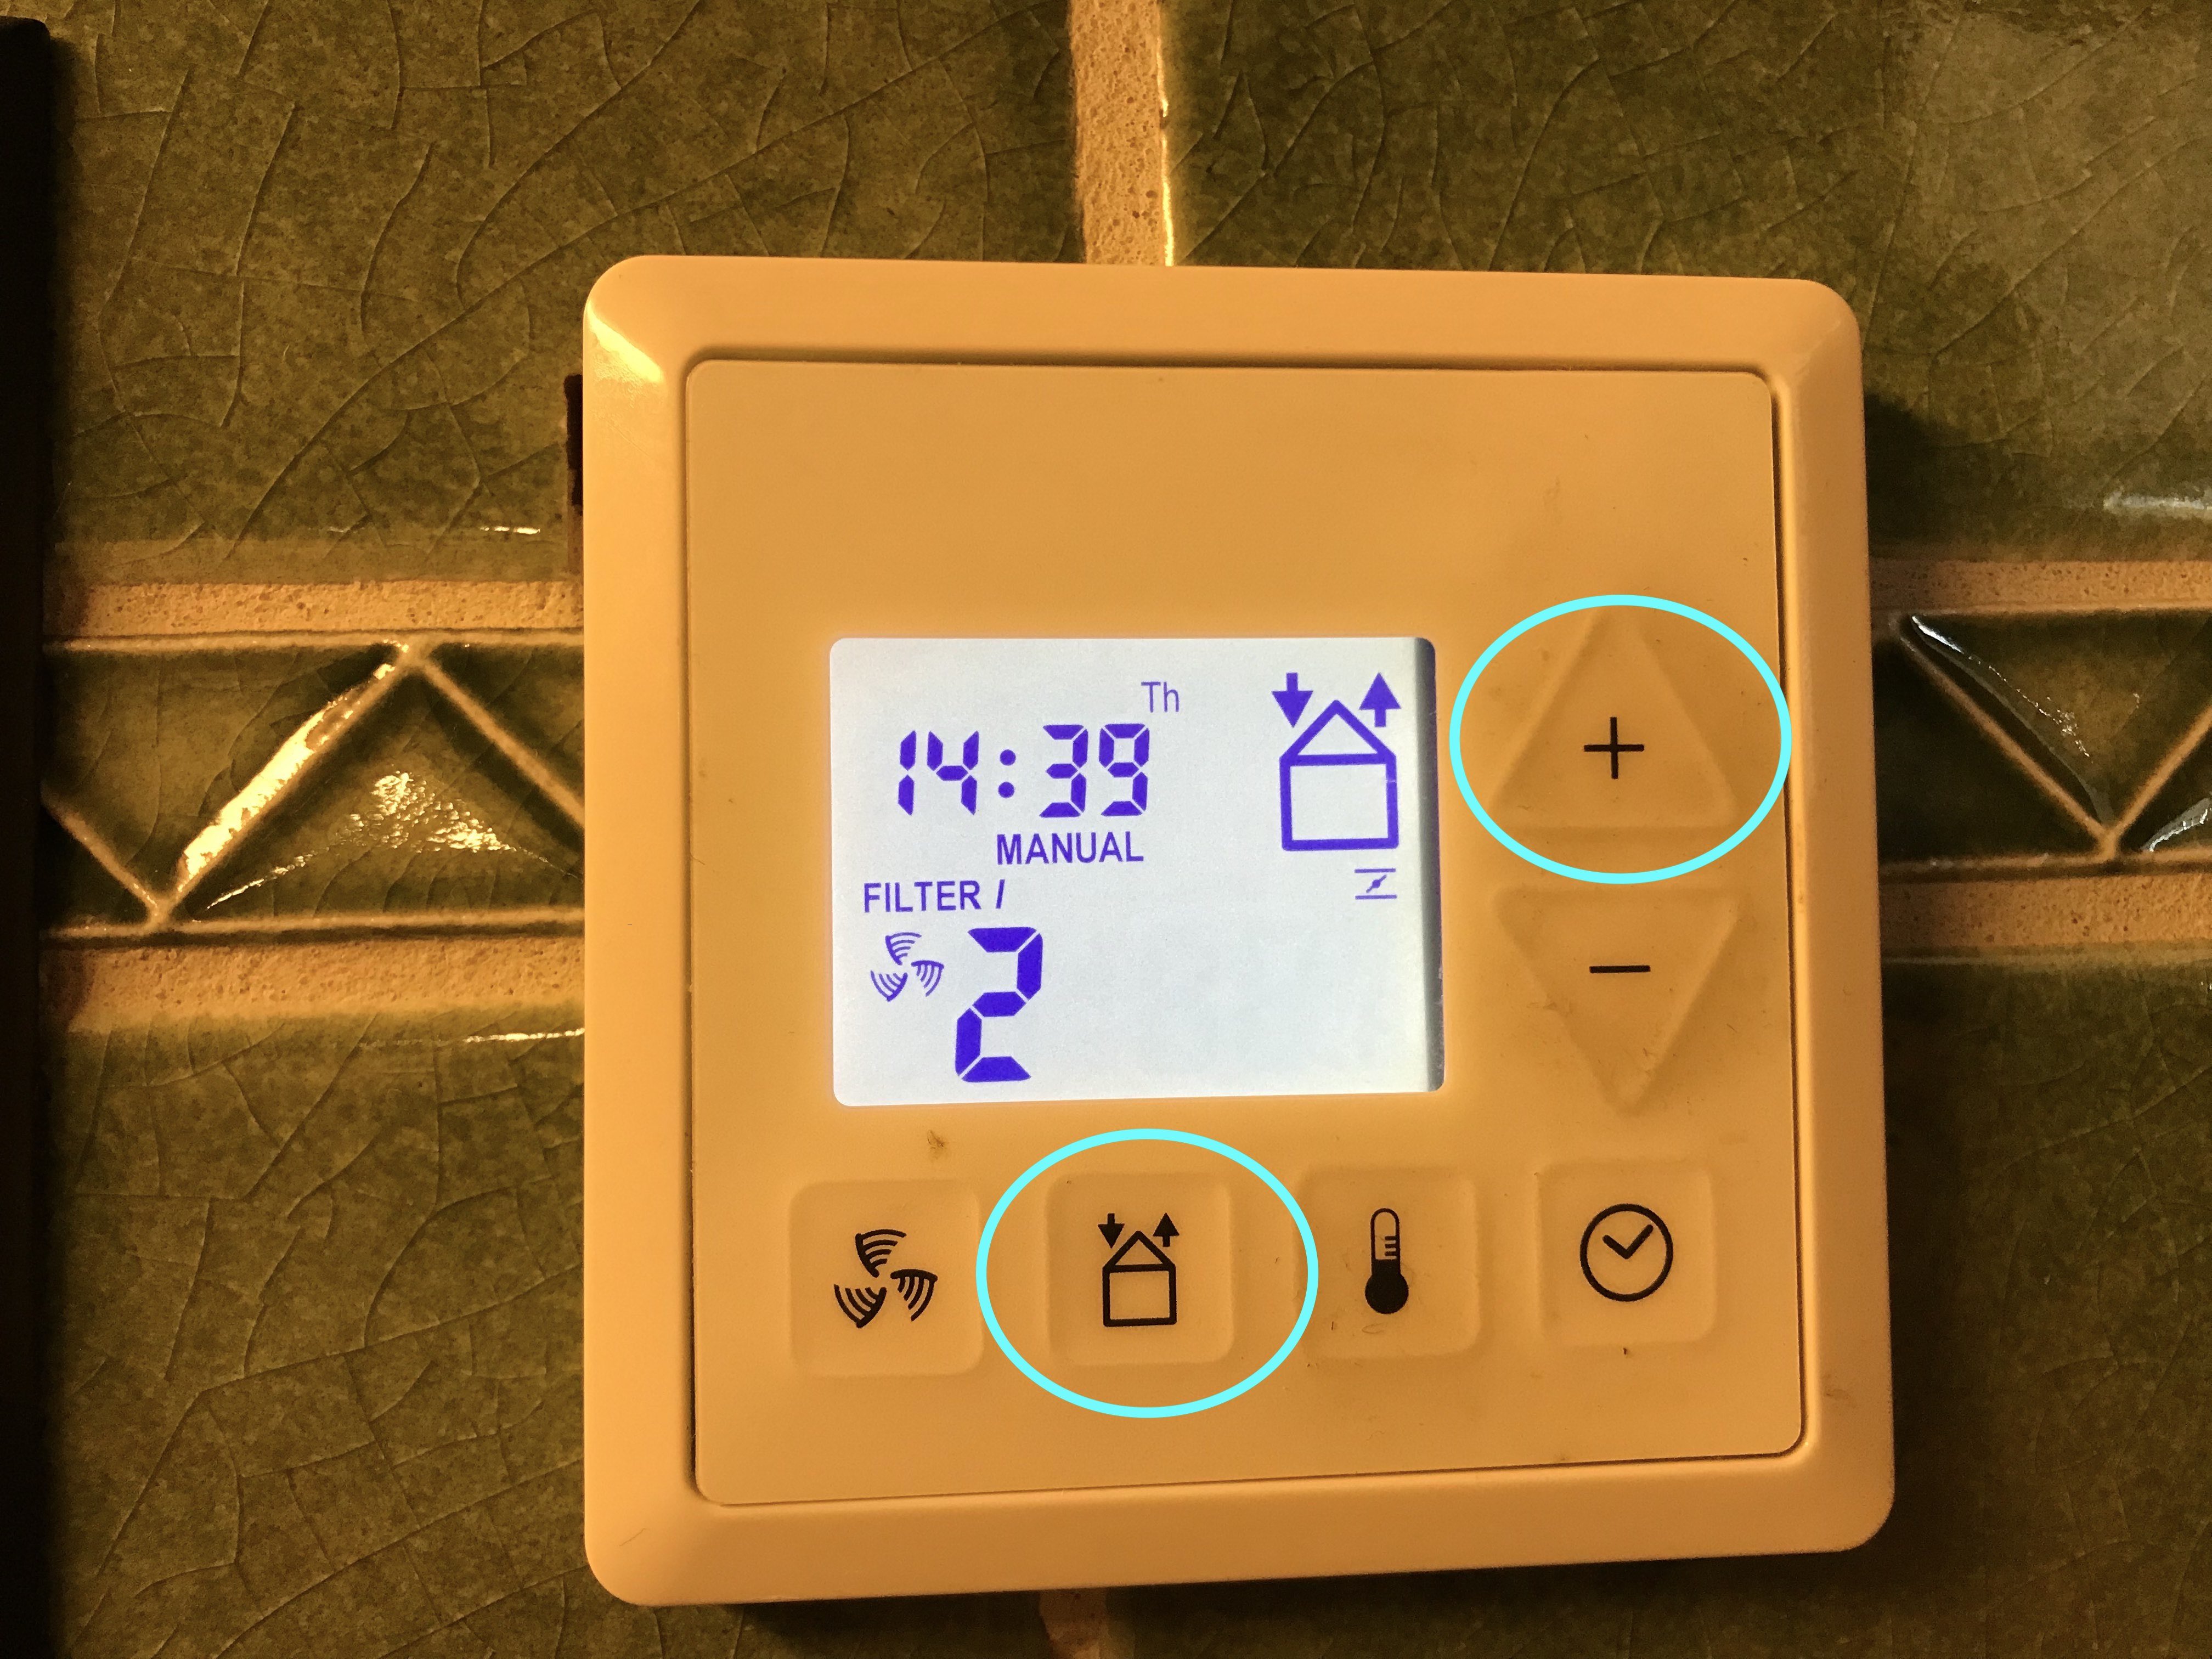
Press the supply/exhaust button and the plus button simultaneously

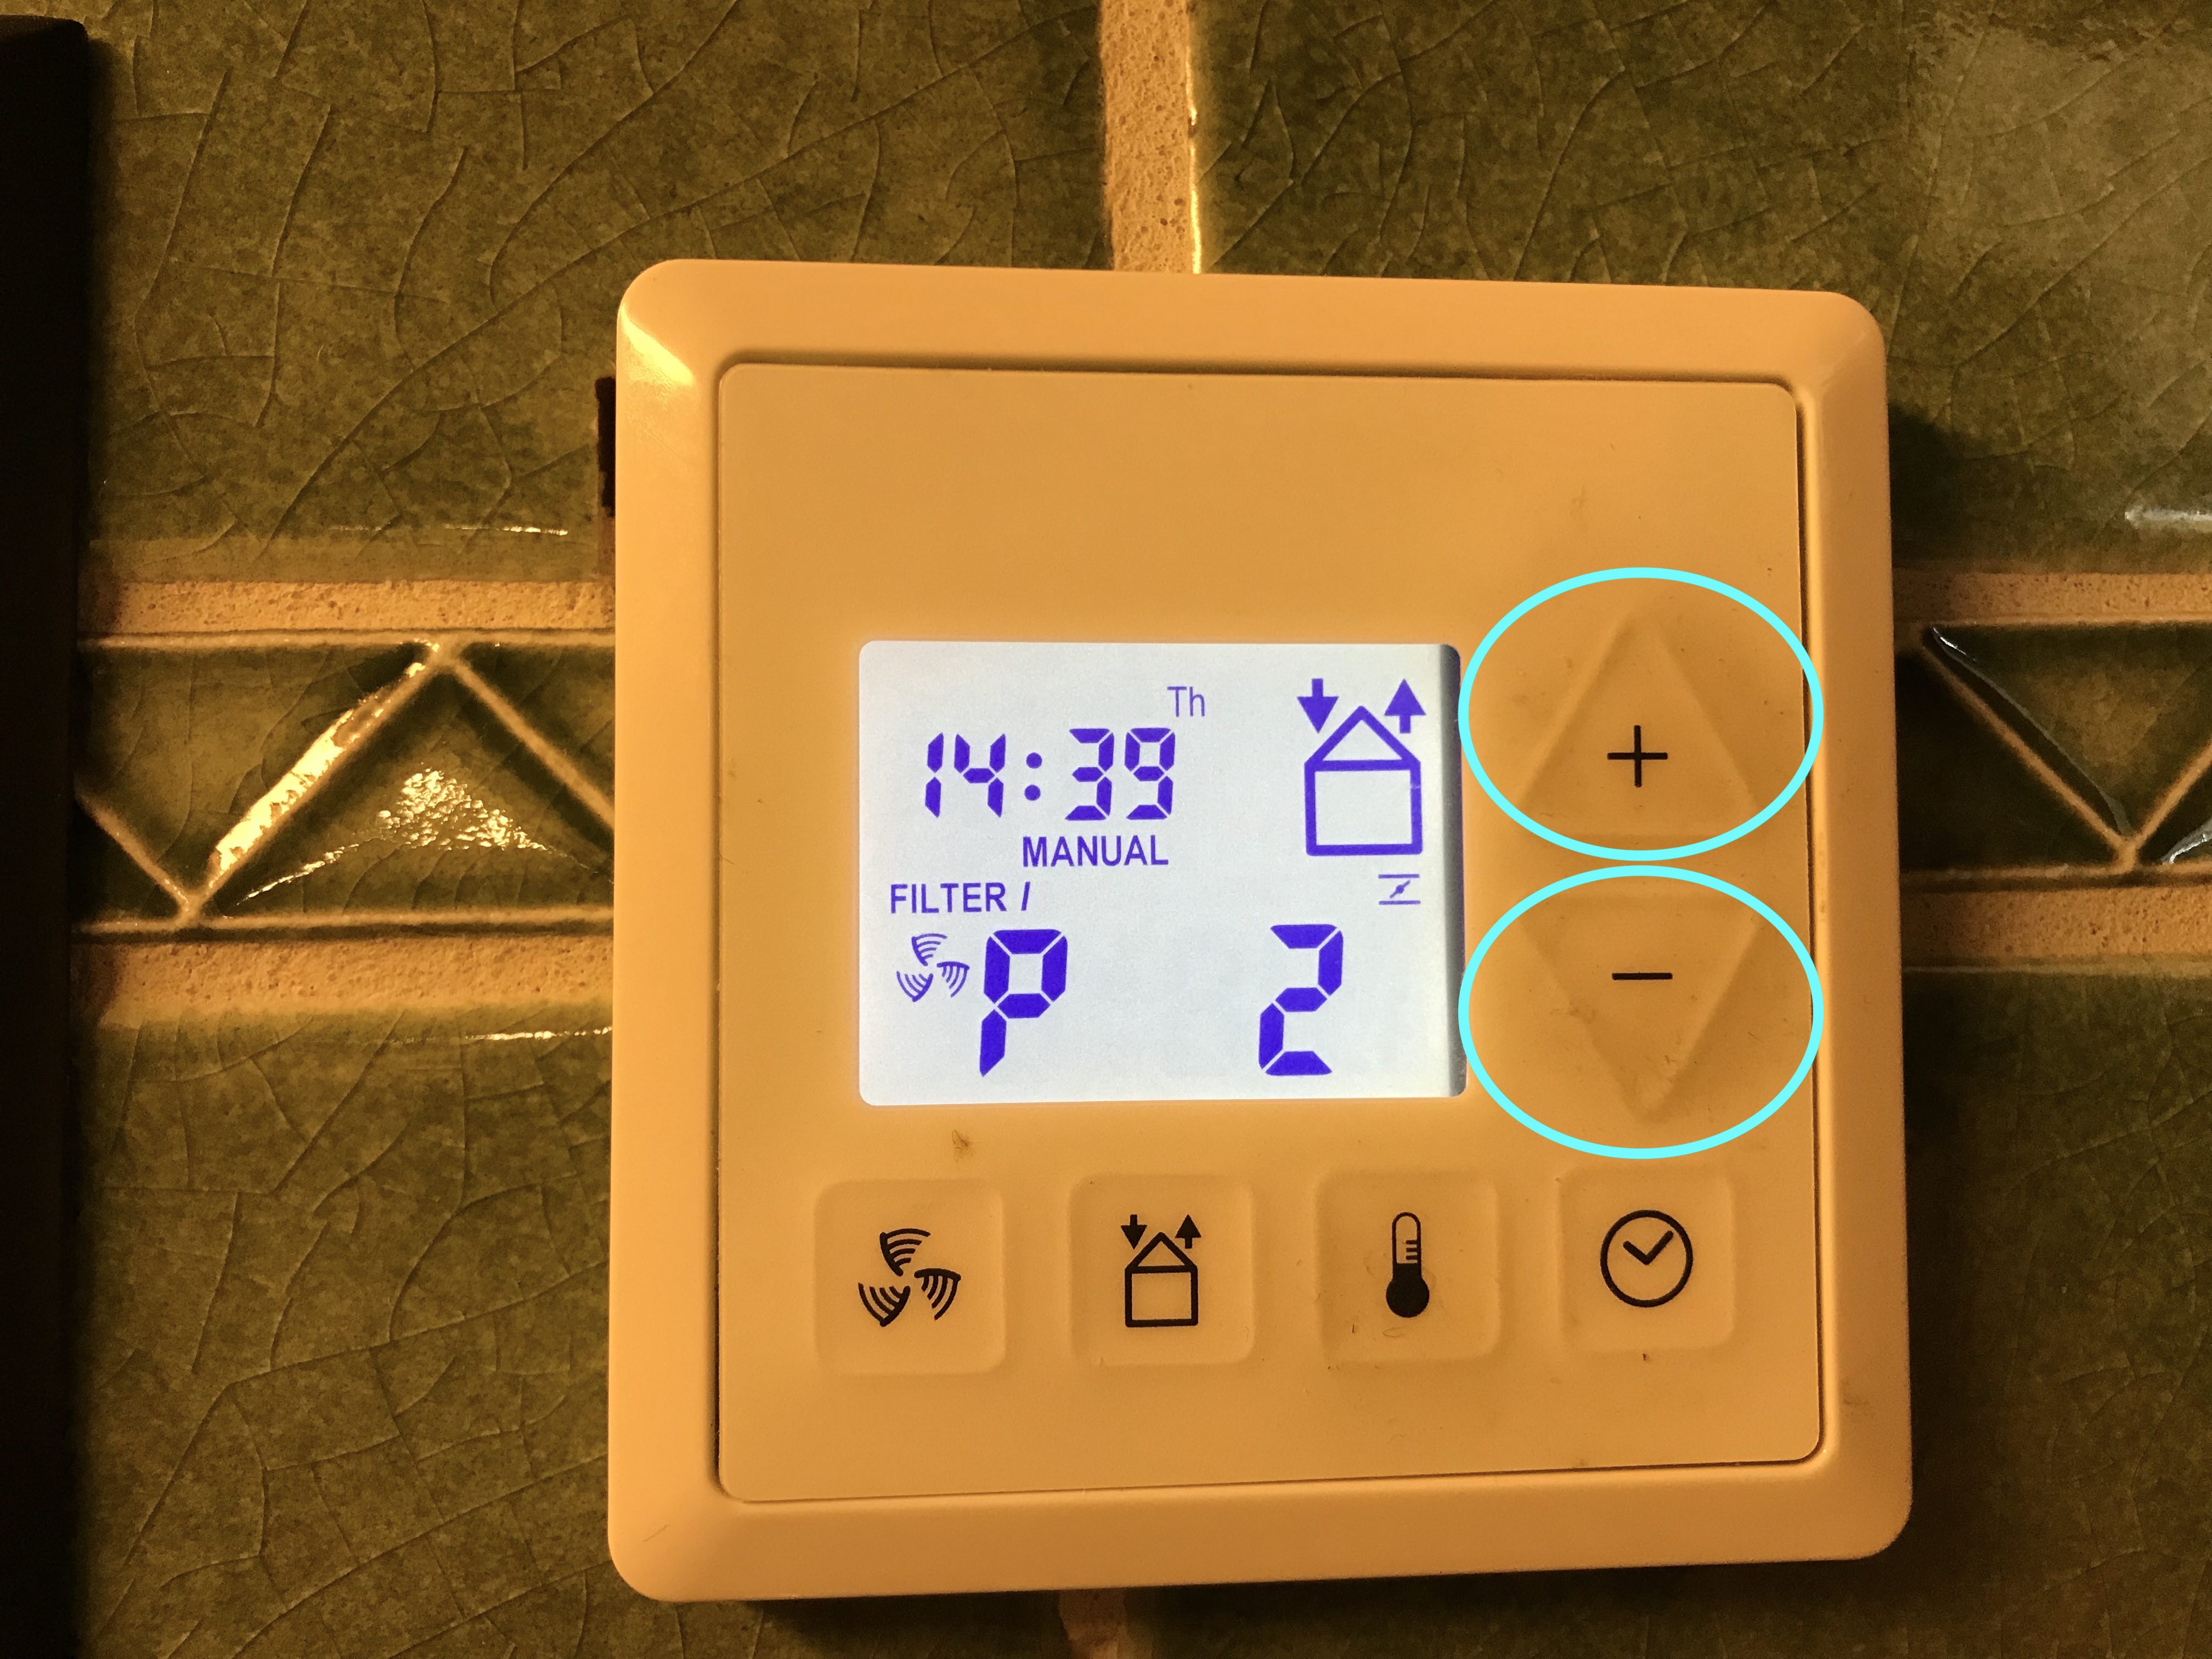
Press plus and minus button simultaneously
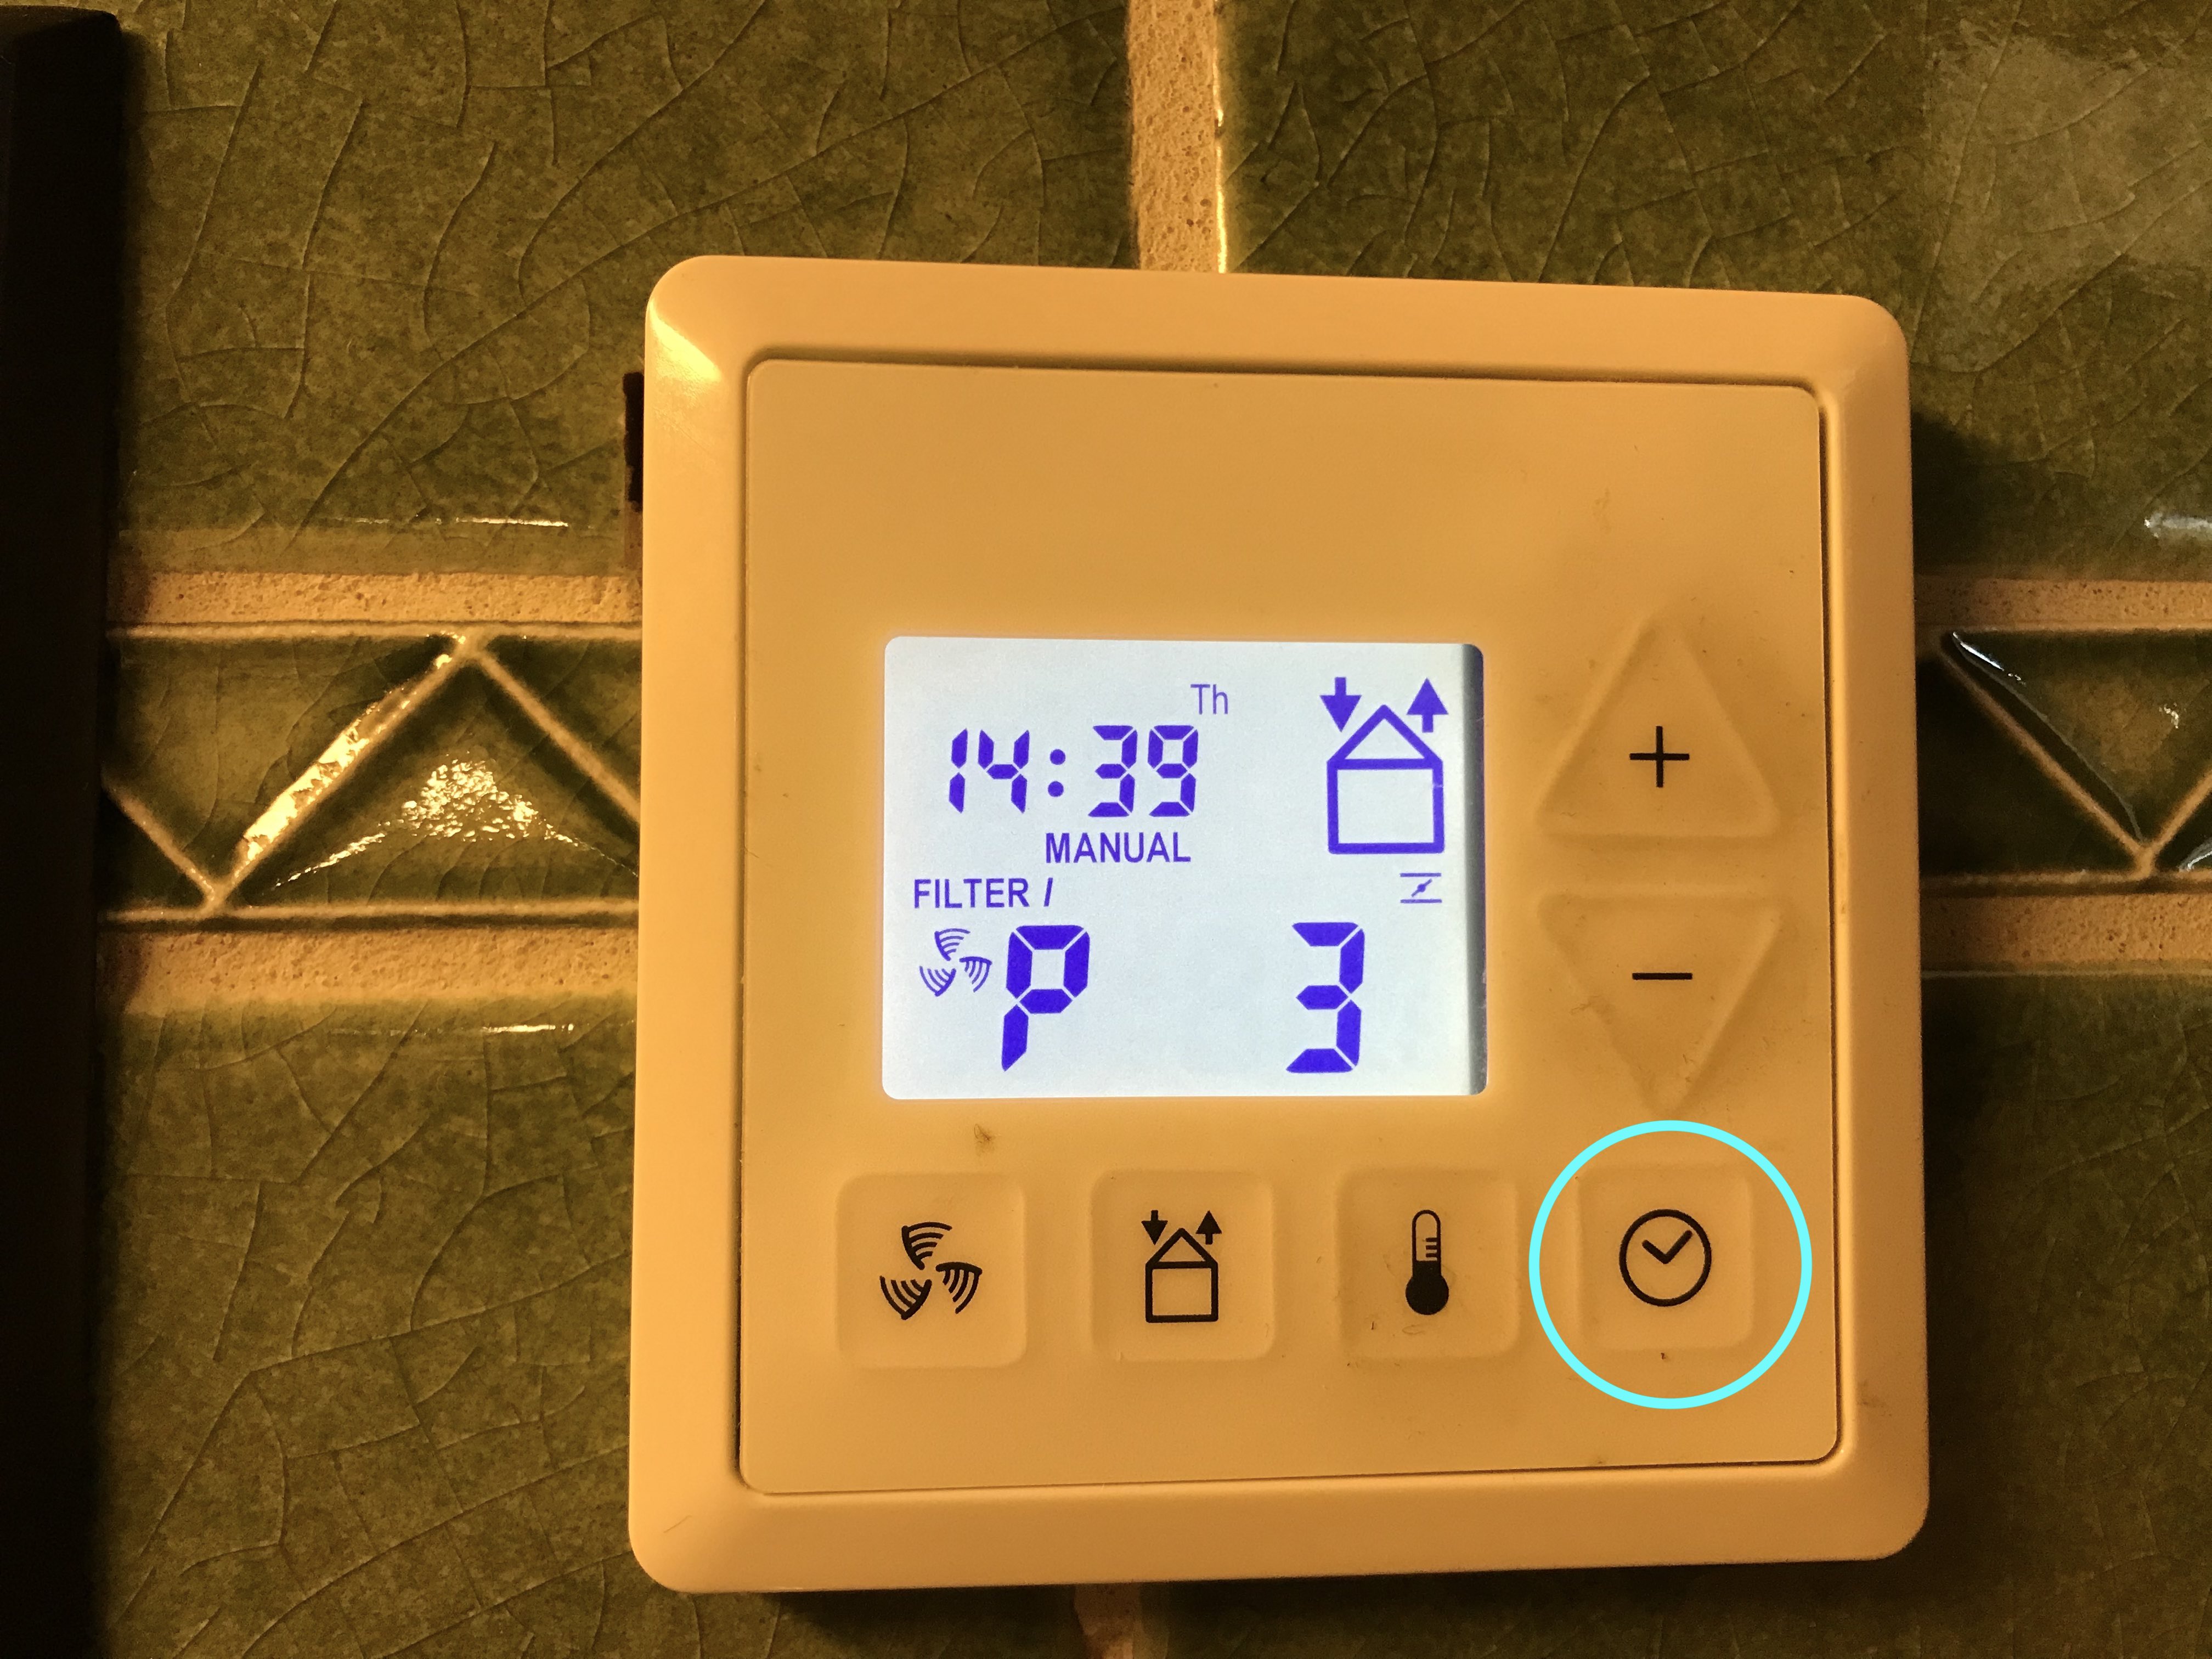
Press clock button

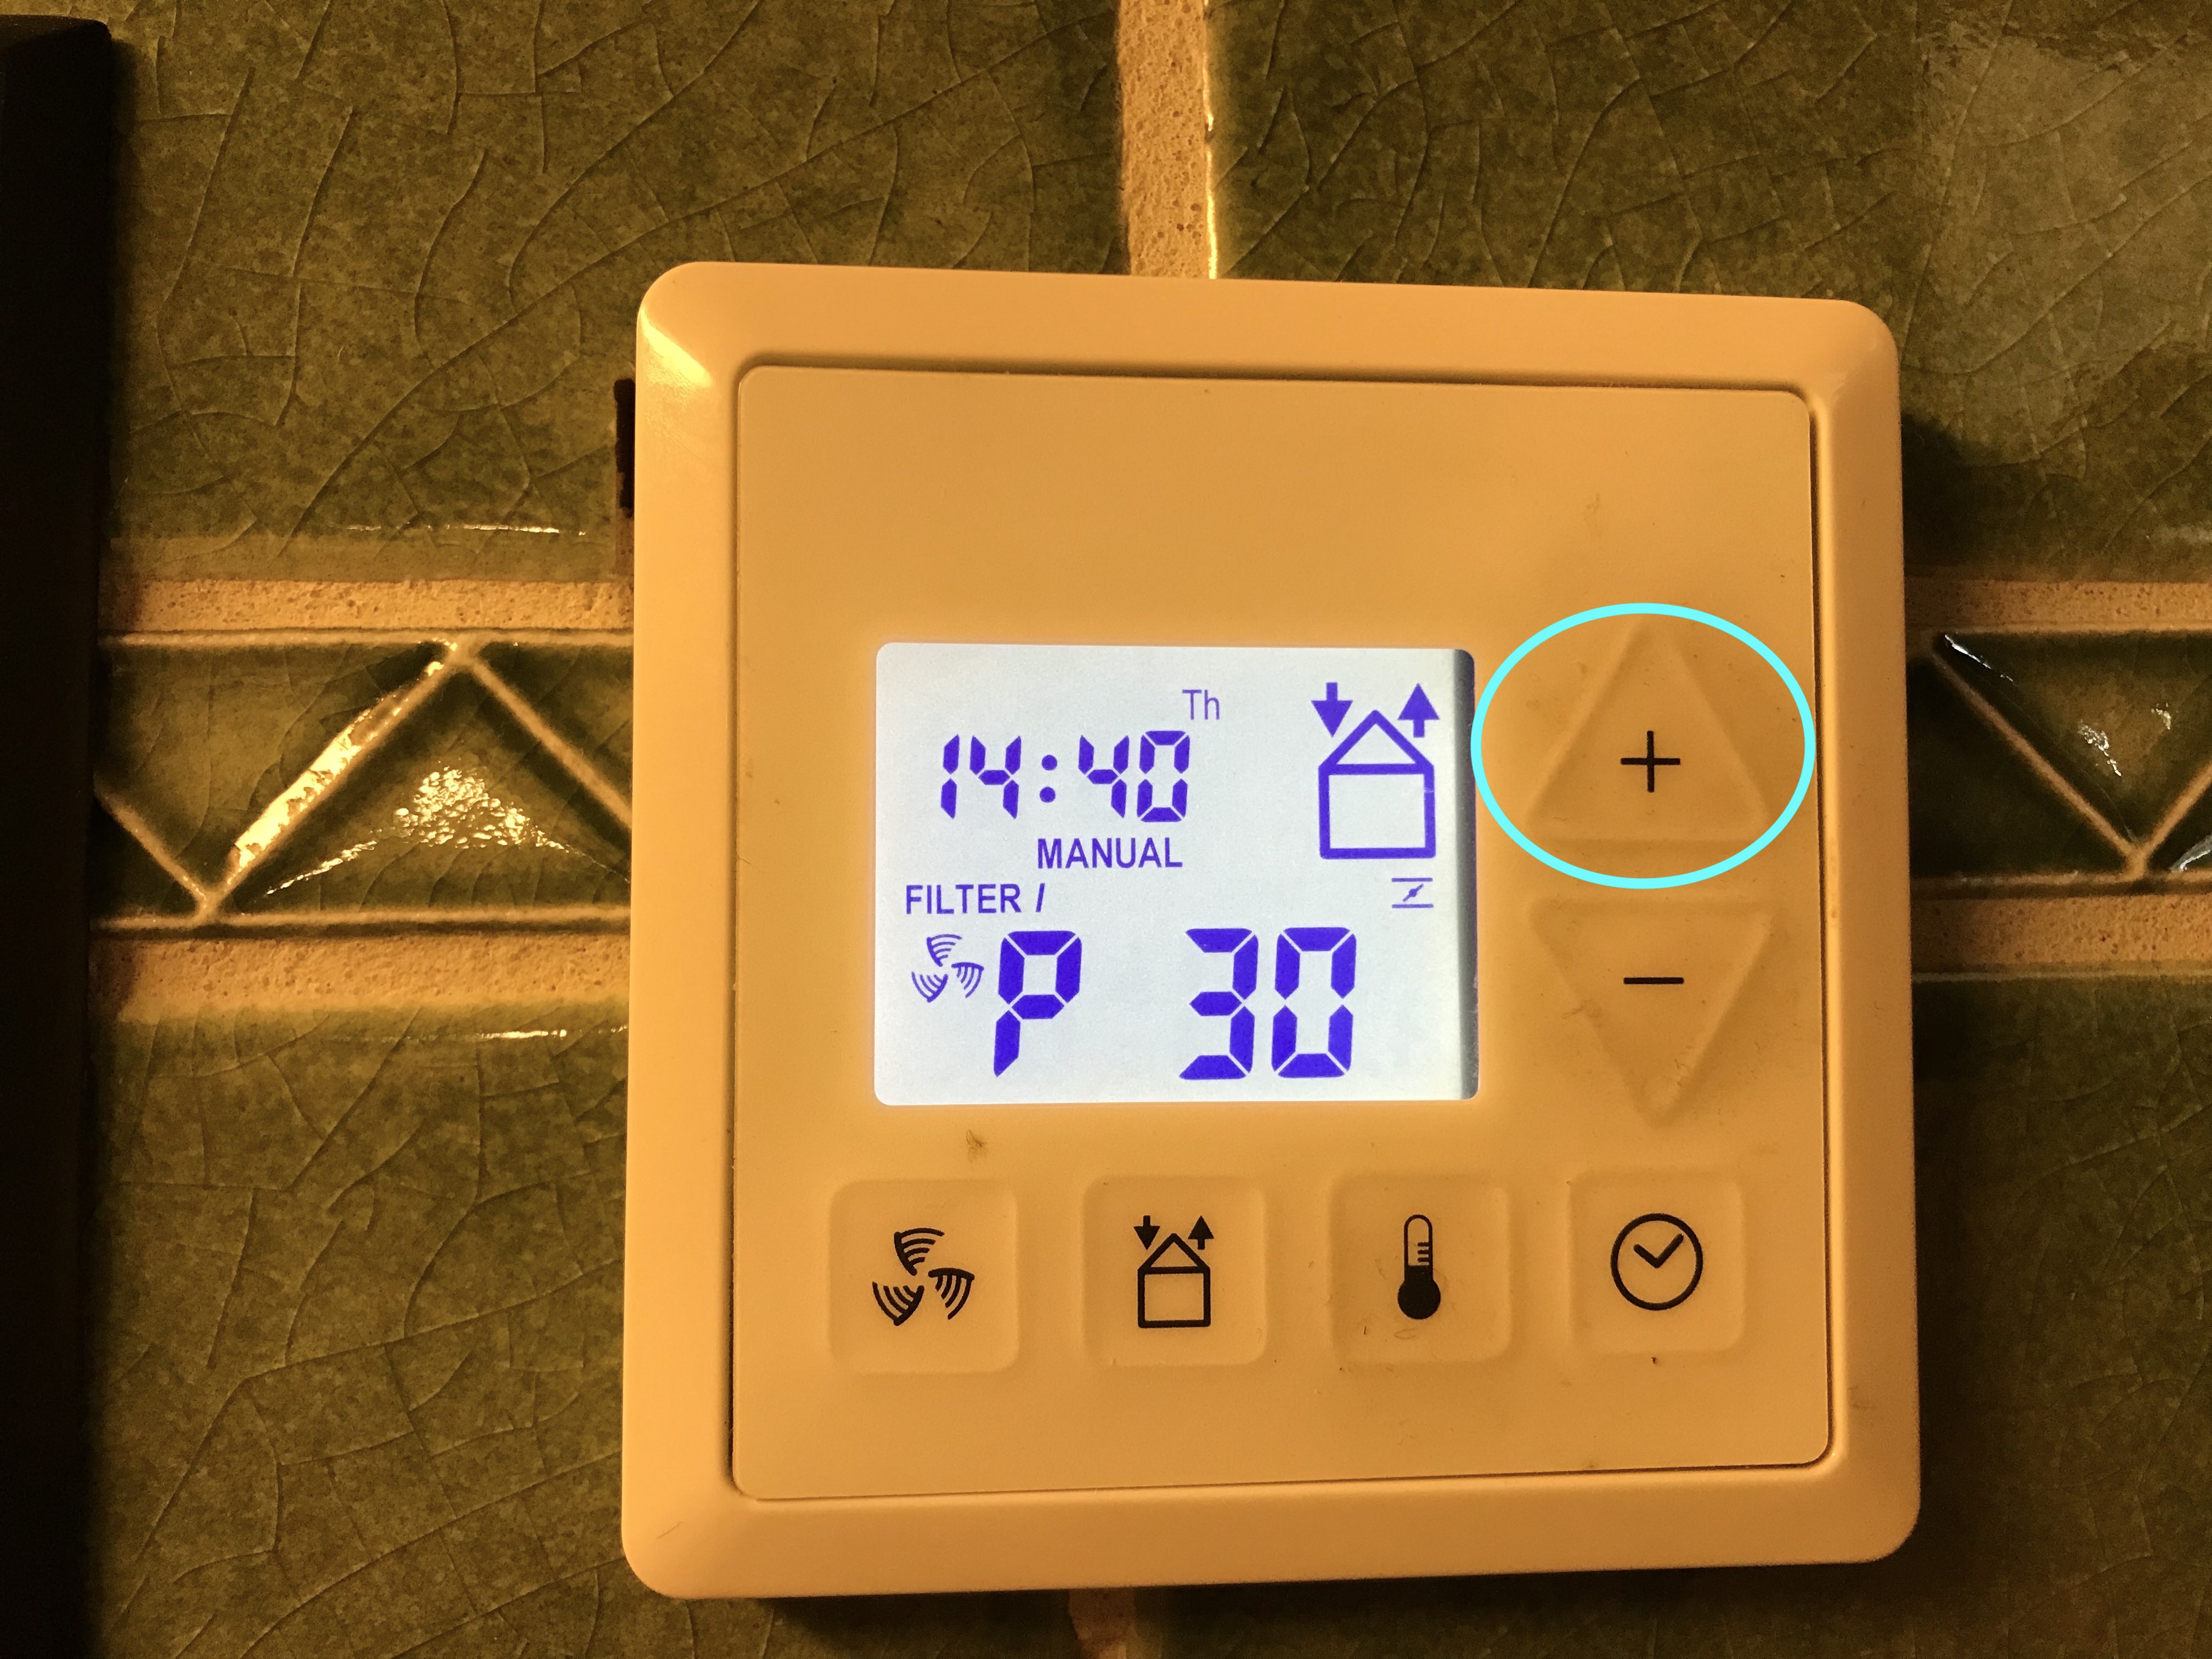
Press plus button to step through P3 menu

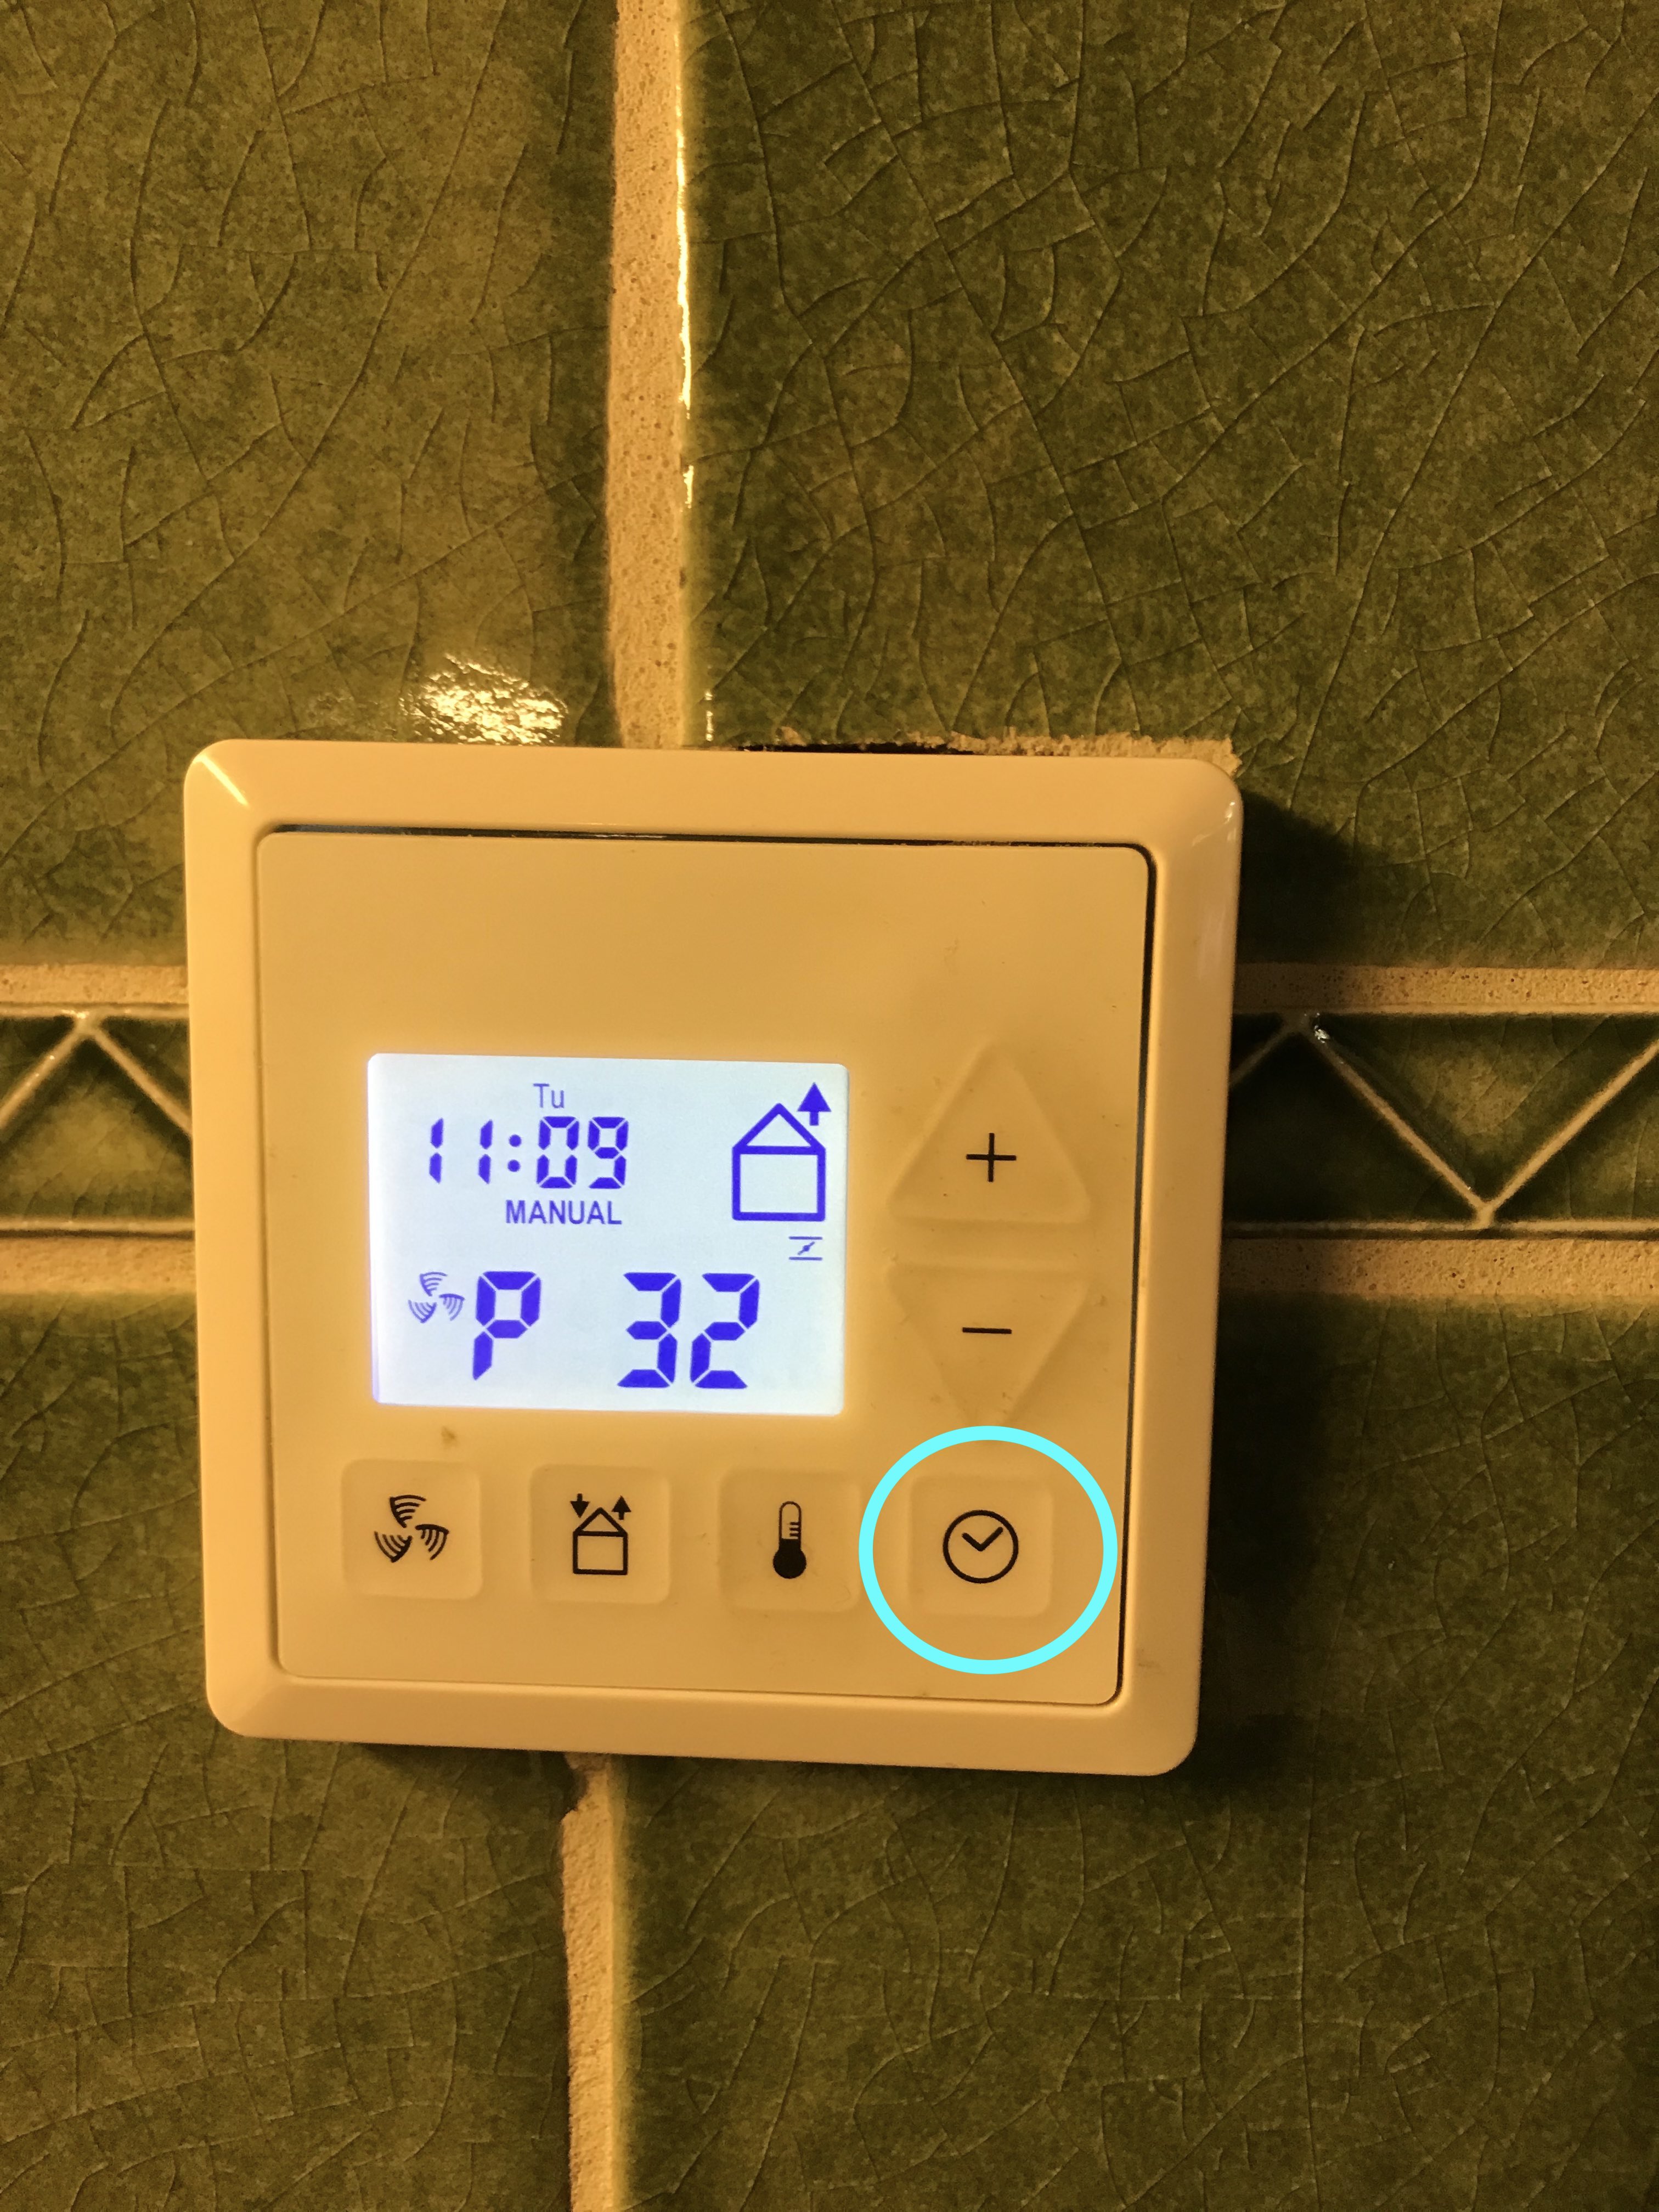
Press clock button to view/adjust value

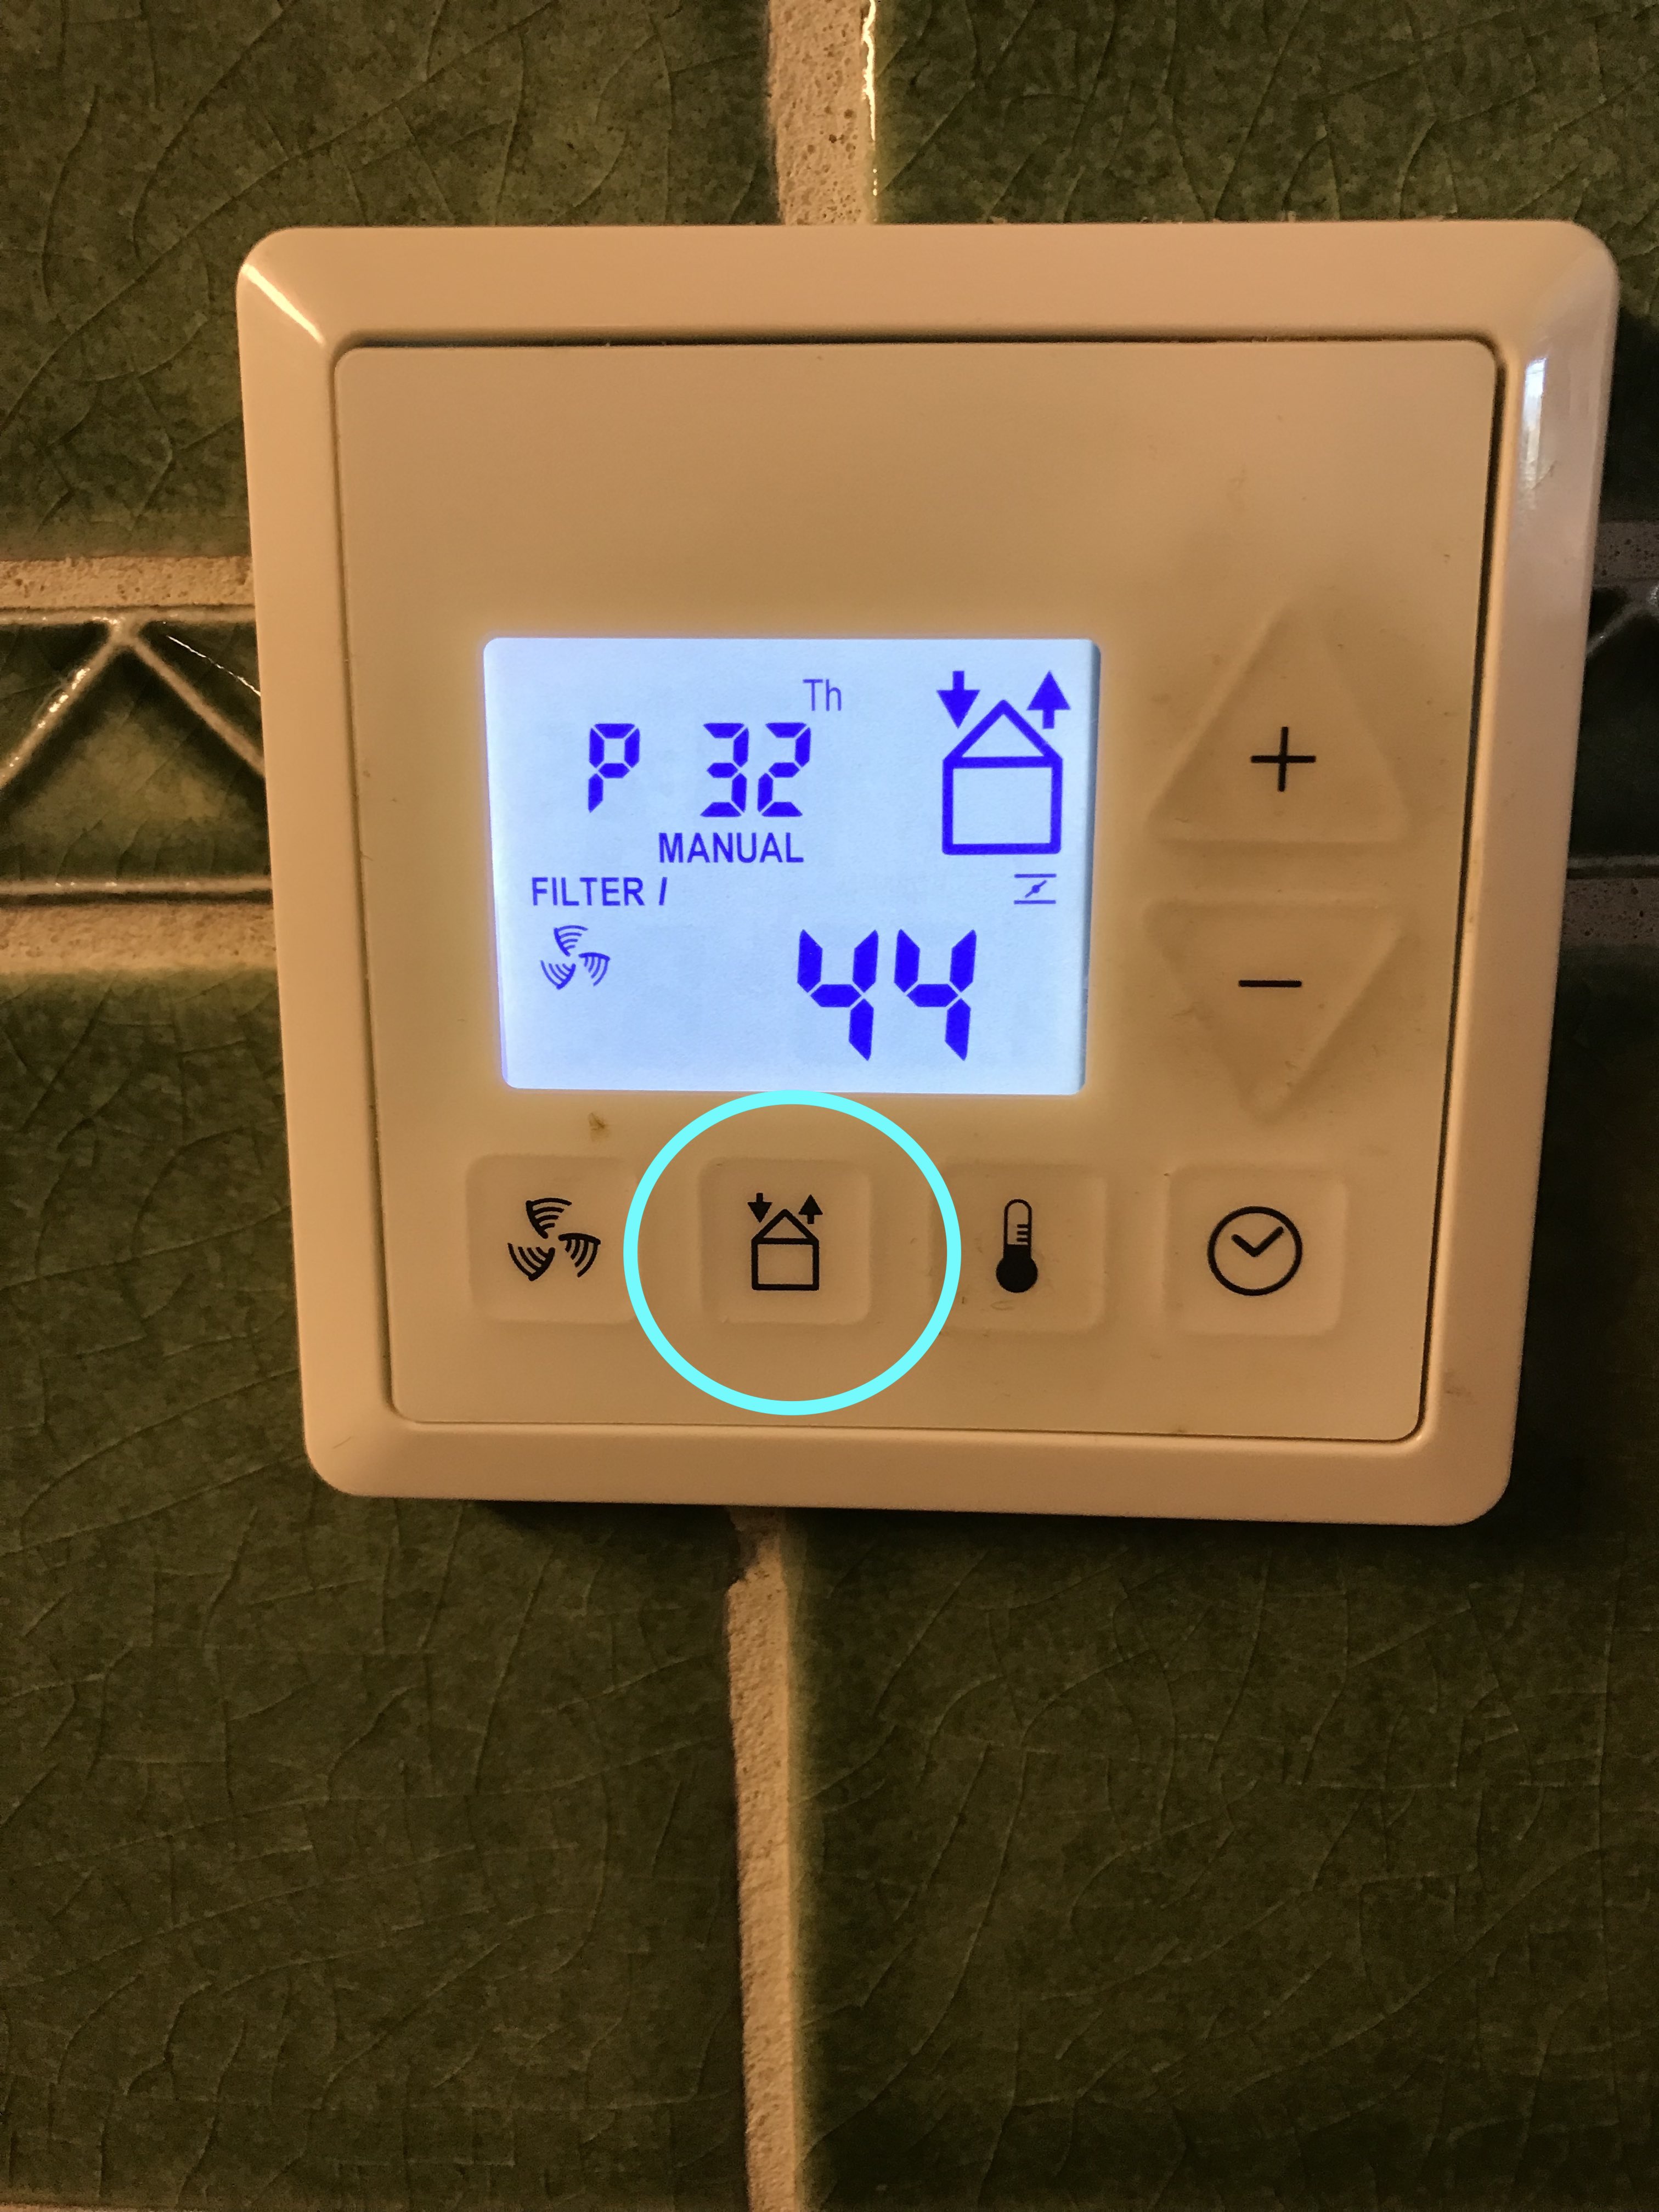
Press Supply/Exhaust button to return to previous menu

Summary of changes made to the P3 menu.
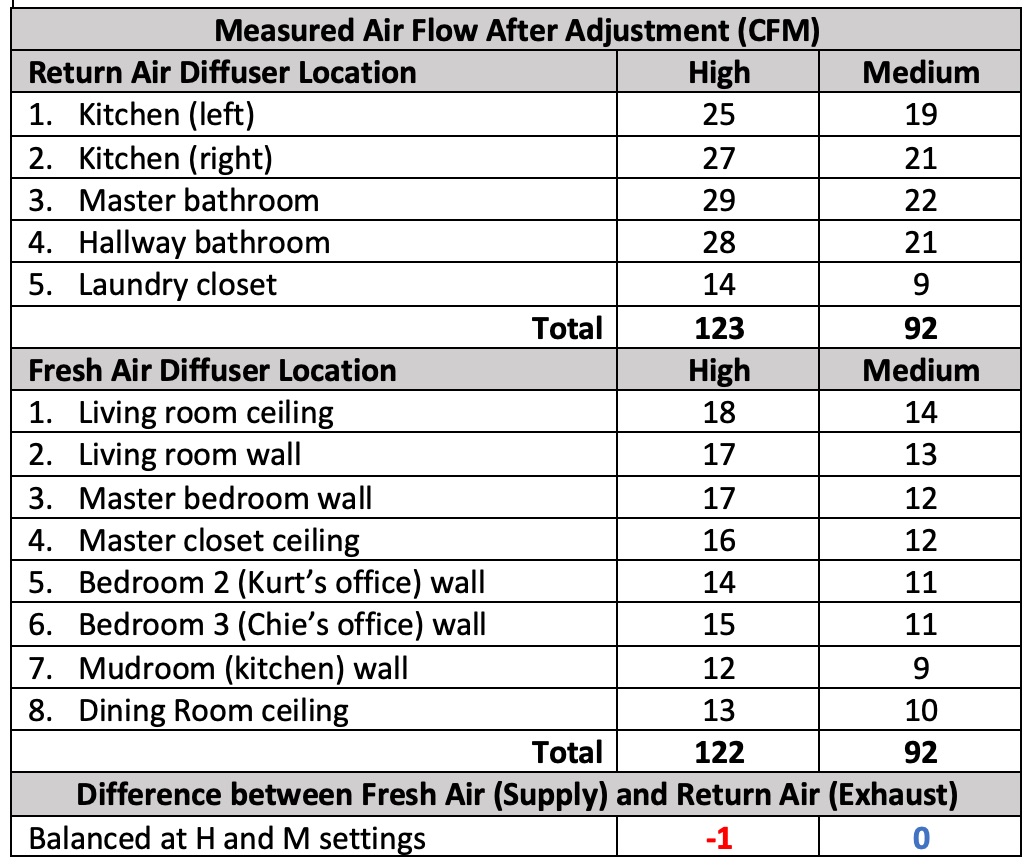
Final Measurement

I measured the air flow at each of the 13 diffusers using the balometer and recorded the airflow. It’s pretty well balanced now.

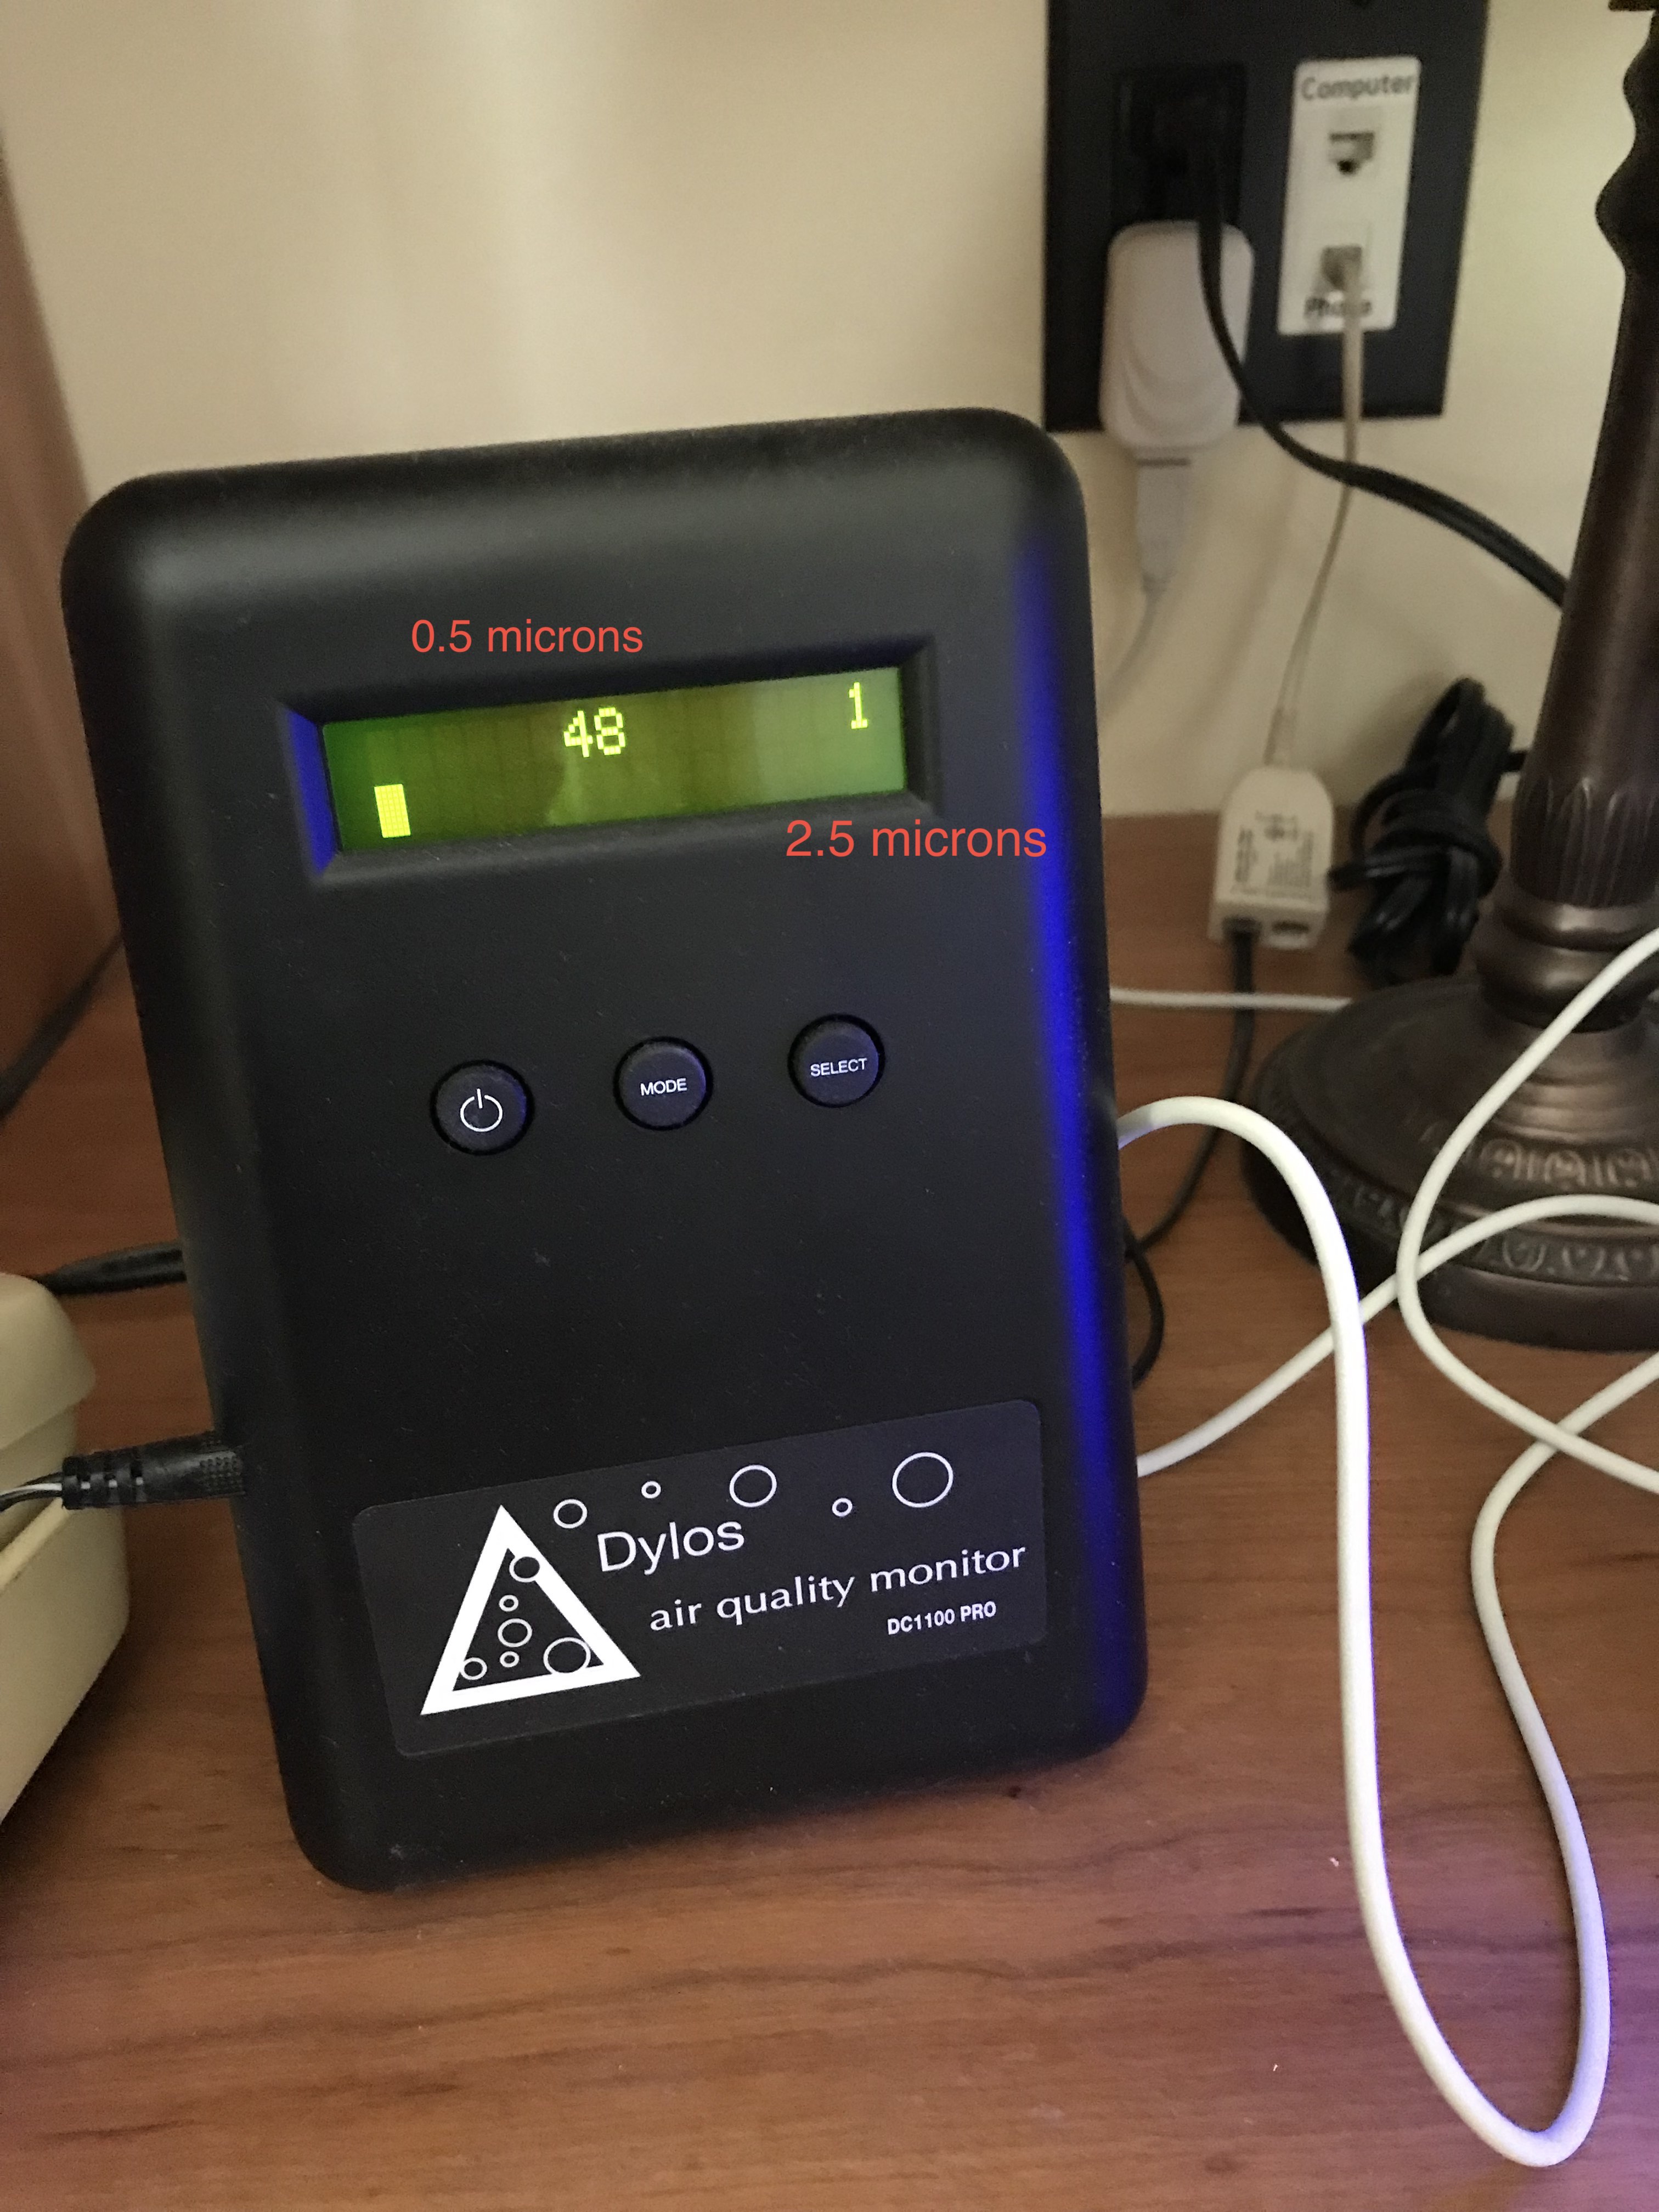
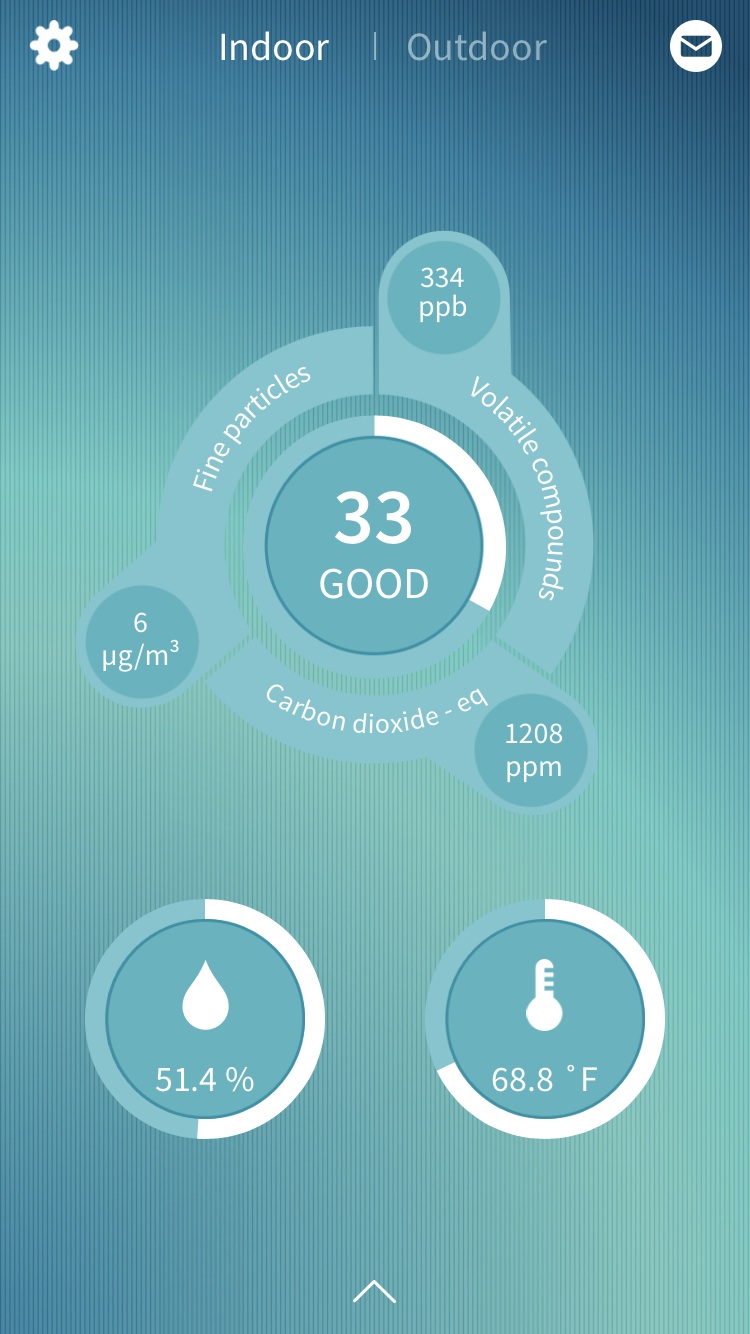
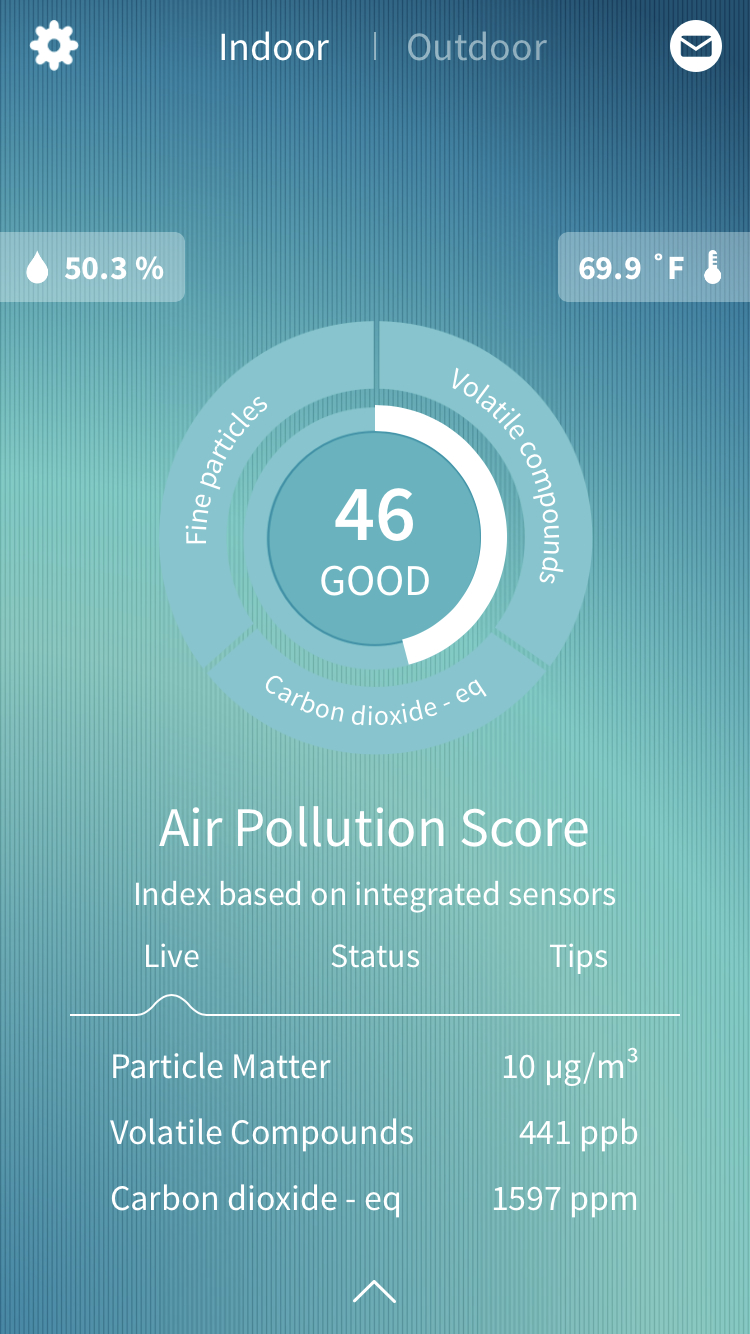
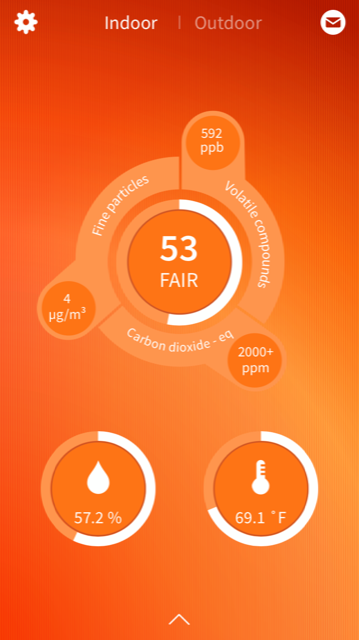
Result: Better Indoor Air Quality

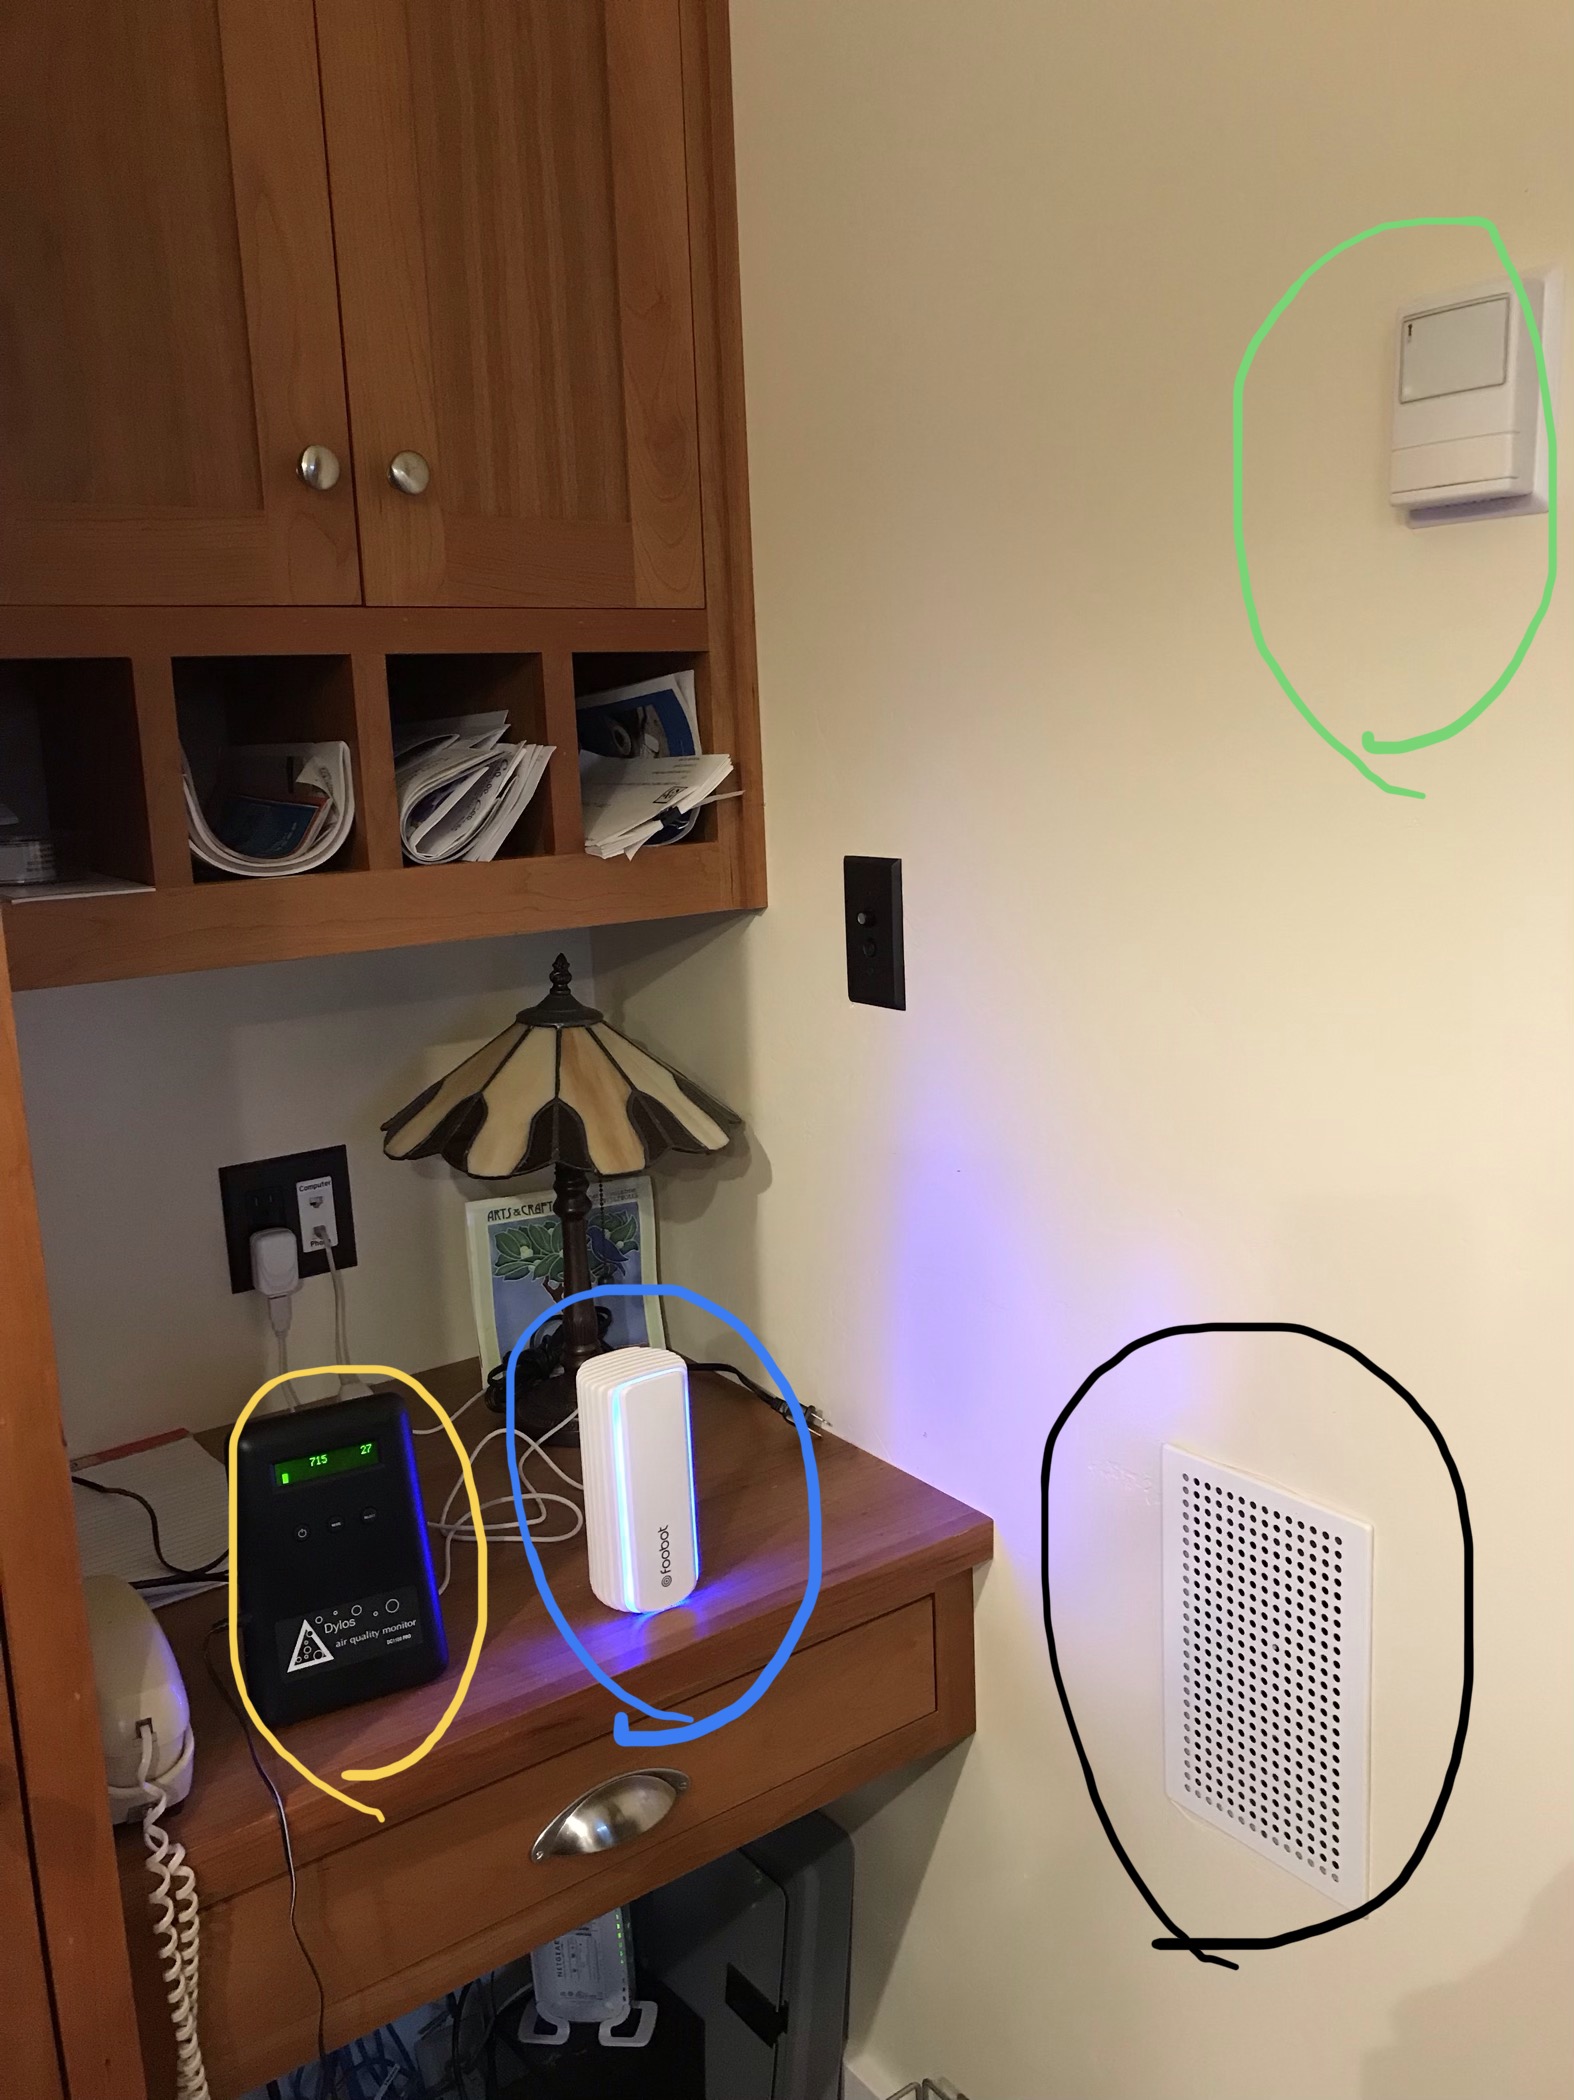
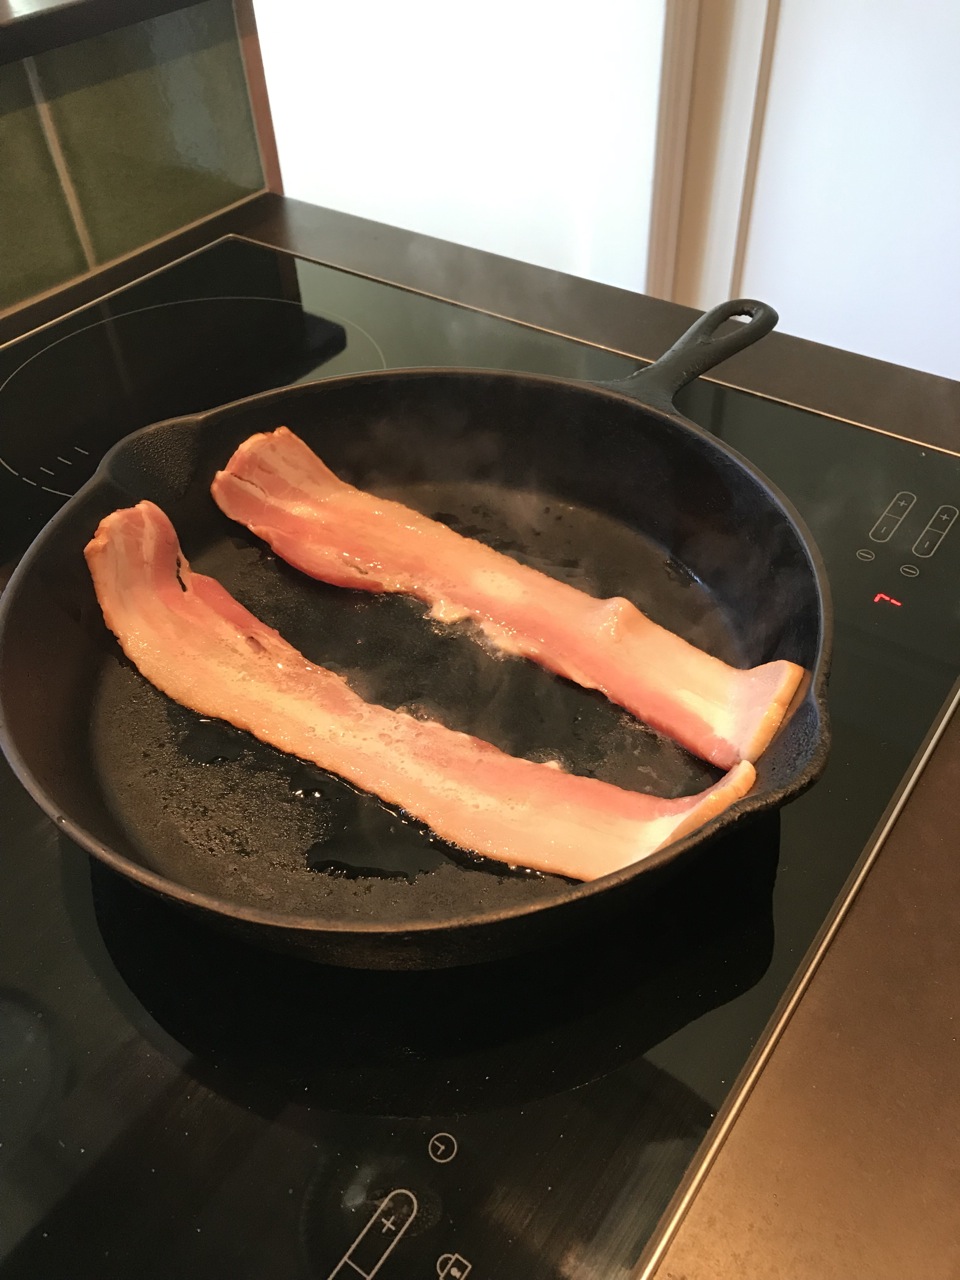
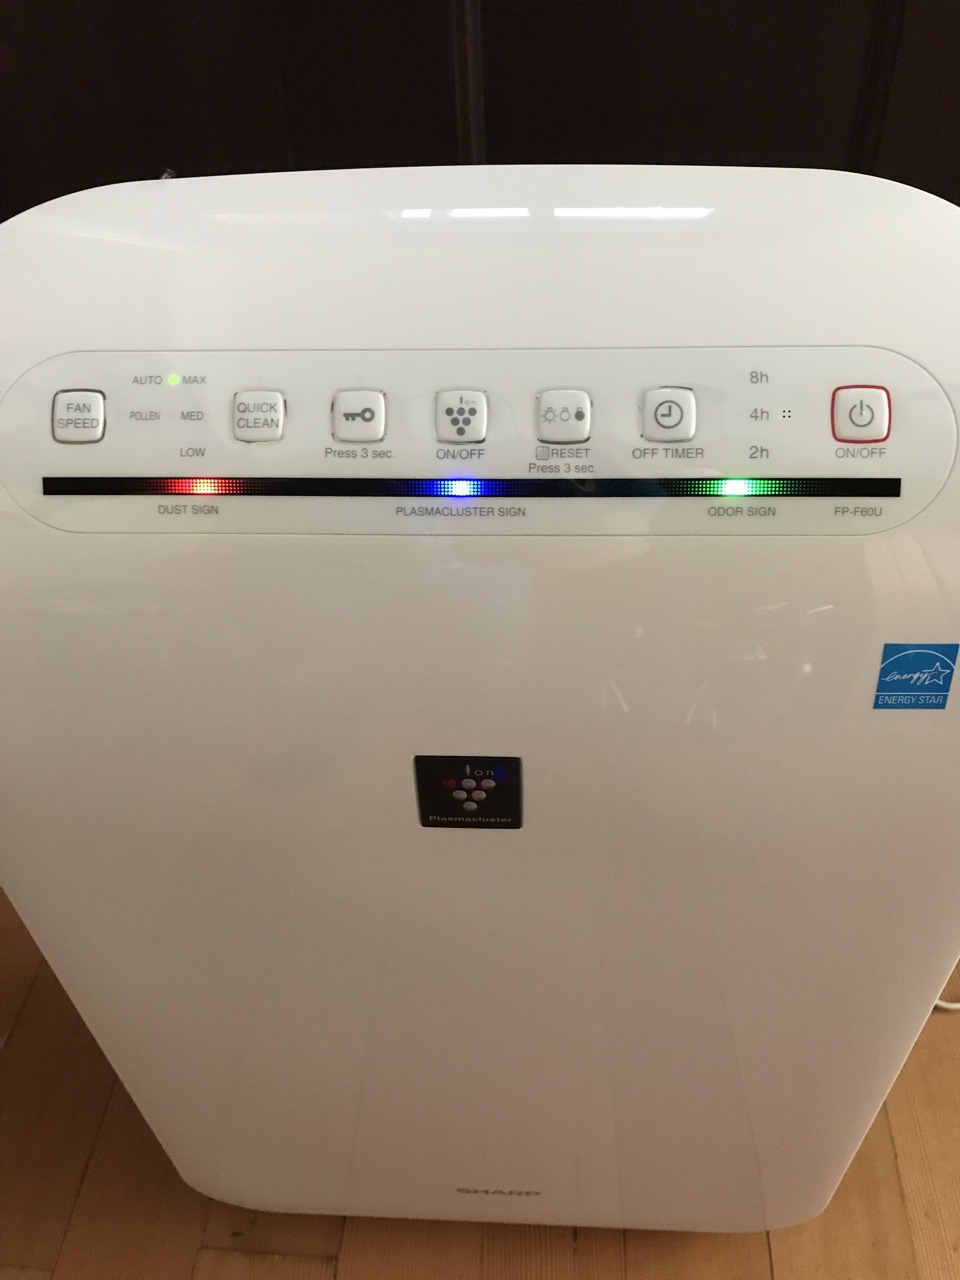
The indoor air quality is better after installing the extra filter. How much better? We haven’t seen numbers this low on the Dylos Air Quality Monitor. We feel better too!

Air Purifier

January 7, 2019

I used to think I didn’t need an air purifier appliance, but that changed in November 2018 when we experienced extended period of unhealthy outdoor air quality due to the wildfires in California. Living in a passivhaus, we knew that our indoor air quality was good. Our home, Midori Haus, is very airtight and the heat recovery ventilator (HRV) system continuously delivers filtered fresh air throughout the house and extracts stale air from the bathrooms and kitchen. Having lived through a bad wildfire season where heavy concentration of smoke traveled for hundred of miles, I now believe that air purifier is beneficial in a high performance home like passivhaus. In this post I will share my experience with an air purifier (FP-F60UW air purifier made by Sharp) and the simple experiment I did in my kitchen to measure the efficacy.

Here is the back view of the air purifier: small opening where fan pulls in air, large HEPA filter, large charcoal filter, and back cover that keeps dusts out.

Air purifier is beneficial because it gives us an additional tool for scrubbing the air to reduce malodorous smell and dirty air. Smoke particles and skunk spray particles are so small that they can slip through the filters we have in place in our ventilation system.

We especially appreciate using an air purifier during these times:

1. Unhealthy outdoor air quality. During the recent California wildfire season, the air quality index in Santa Cruz hovered around 179 (unhealthy) and we could smell the smoke inside the house. In the past, we simply turned off the HRV when we detected fire smoke from fireplaces in the neighborhood. This strategy didn't work for us when the smoke lingered outside for over a week. Running the air purifier helped reduce the tiny smoke particles that came into the house.

2. Skunk spraying in the neighborhood. On November 10, 2018, we woke up to a stinky smell inside our house after our neighbor’s dog got sprayed by a skunk in the middle of the night. We worried about the smell lingering during the day because we were about to receive over 20 visitors for a house tour. That worry dissipated after we ran an air purifier (FP-A80UW) for about 10 minutes in each room.

3. Cooking indoors when it is very cold or very hot outside. We often open our windows in the kitchen to quickly flush out the cooking smells. This has the side effect of quickly raising the kitchen temperature (during a summer heatwave) or quickly lowering the kitchen temperature (during a coldsnap). For us, the summer heatwave is more difficult to deal with because we don’t have air conditioning. Using an air purifier speeds up clearing the air in the kitchen. The HRV can remove the cooking odors only so fast.

How effective was the  FP-F60UW air purifier in my kitchen? These are the key observations from my kitchen experiment:

Observation 1. Air purifier cut down the time to clear the air in the kitchen by half. This is compared to the baseline of running a recirculating range hood and having the HRV extract the air out of the kitchen.

Observation 2. Air quality is much better when the air purifier is turned on at the start of cooking. Trying the clean up accumulated dirty air post-cooking takes much longer.

Observation 3. The Plasmacluster Ion Technology feature seems to have a greater impact on particles than VOC.

Observation 4. I can still smell the cooking odors in the kitchen even after the air quality monitors indicate a low number. This is probably due to the small particles stuck on the cabinets, walls, and my clothes. Plus our nose is more sensitive than monitoring equipment.

Observation 5. The use of the recirculating range hood over the cooktop didn't seem to help. In fact, it appeared to lengthen the time it takes to clear the air. Perhaps this range hood is due for cleaning and filter change.

Observation 6. The fastest way to clear the air in the kitchen is to open the window. This is best when the outdoor air quality is good.

Observation 7. The air in the rest of the house smells clean. Closing the various doors between the rooms is effective. Our old-house style room layout has a door between the kitchen and the dining room, between the dining room and the living room, and between the living room and the hallway. 

Rest of this post will go into the details of my kitchen experiment. If you're curious about them (criteria, method, and equipment) read on. If you're satisfied with the summary above, feel free to stop here.

Kitchen Environment

Unlike modern home with a great room layout, our kitchen is a self-contained room. A pocket door separates the kitchen from the dining room. There is a small gap in the pocket door which allows air from the dining room to be pulled into the kitchen when there is a negative pressure in the kitchen when the HRV is on. There are two houseplants (peace lily and spider plant) in the kitchen. The induction cooktop faces the window and the island range hood hovers over the cooktop.

Area: 206 square feet

Ceiling height: 9 feet

Window: 29 square-foot opening

Appliances Used

Miele Induction Cooktop is not a gas cooktop, so no combustion byproducts created during cooking.

Zehnder ComfoAir 350 HRV: In the kitchen there are two exhaust registers for extracting a total 47 CFM on high; one supply register supplying 13 CFM. See this post for the filters installed in the HRV system. (Supply register circled in black in the photo below)

Kobe Recirculating Range Hood: 400 CFM on high. This island type recirculating range hood is no longer made.

Sharp FP-F60UW air purifier: This unit is recommended for a room that is 280 square feet or smaller. 400 CFM on high used for kitchen experiment. This high speed setting measured 48W on my Kill A Watt. At low setting, the 44 CFM fan speed is quiet enough to run it in the bedroom overnight.

Air Quality Monitors

We have three devices in the corner of our kitchen to measure air quality. For description on these and other air quality monitors, take a look at this article from Energy Smart Home Performance.

Dylos Pro measures concentration of particles. The larger number represents a count of particles greater than 0.5 microns. The smaller number represents a count of particles greater than 2.5 microns. (circled in yellow)

FooBot measures particles and volatile organic compound (VOC). (Circled in blue)

WELserver measures and collects temperature, humidity and VOC measures using a custom sensor. (Circled in green)

Criteria for “clean air”

I’ve used visual indicator of Foobot. It glows blue when air quality is good and orange when air quality is bad. Measurement was taken at various intervals until Foobot turned blue.

Experiment senarios

For scenarios 1, 2, and 3, two strips of bacon were fried for six minutes total (3 minutes each side) in a cast iron skillet on induction cooktop, then transferred to a plate. Air clearing actions, timing, and measurement began when cooking ended. This measured the efficacy of air clearing action on accumulated dirty air.

For scenarios 4, 5, and 6, two scallion pancakes were cooked in a cast iron skillet each for 14 minutes (7 minutes each side), then transferred to a plate. Air clearing action, timing, and measurement began when cooking started.

Scenario 1: Baseline

This scenario answered the question, “How long does it take to clear the air in our default mode?”

2 strips of bacon

HRV on high

Range hood on high

Measurement started at the end of cooking

35 minutes to clear the air.

Scenario 2: Open Window

This scenario answered the question, “How long does it take to clear the air by opening the windows at the end of cooking?”

2 strips of bacon

HRV on high

Range hood on high

Opened window and started measurement started at the end of cooking.

External air temperature was 58F, kitchen temp dropped from 73F to 72F.

10 minutes to clear the air.

Scenario 3: Air Purifier (Ion on)

This scenario answered the question, “How long does it take to clear the air if the air purifier was used end of cooking?”

2 strips of bacon

HRV on high

Range hood on high

Turned on air purifier (with Ion on) and started measurement started at the end of cooking.

The dust sign on the air purifier turned red, indicating dirty air.

17 minutes to clear the air

Scenario 4: Air Purifier (Ion on), HRV off, range hood on

This scenario answered the question, “How long does it take to clear the air if the air purifier was used at the start of cooking with the HRV off?”

2 scallion pancakes

HRV off

Range hood on high

Turned on air purifier (with Ion on) and started measurement started at the start of cooking

43 minutes to clear the air

WELserver data display

Scenario 5: Air Purifier (Ion on), HRV on, range hood off

This scenario answered the question, “How long does it take to clear the air if the air purifier (with Ion on) was used at the start of cooking with the HRV on and range hood off?”

2 scallion pancakes

HRV on high.

Range hood off

Air purifier (Ion on) was turned on at the beginning of cooking.

Initial measurement was taken at the beginning of the cooking.

Air was clean the entire time. (Foobot never turned Orange!)

Scenario 6: Air Purifier (Ion off), HRV on, range hood off

This scenario answered the question, “How long does it take to clear the air if the air purifier (with ion OFF) was used at the start of cooking with the HRV on and range hood off?”

2 scallion pancakes

HRV on high.

Range hood off

Air purifier (Ion off) was turned on at the beginning of cooking.

Initial measurement was taken at the beginning of the cooking.

Air was clear the entire time. (Foobot never turned Orange!)

If you're still reading and are curious about the test data, take a look at this Google Docs spreadsheet.

Thank you for reading this post. This air quality measurement experiment gave me a better insight to the effects of cooking and indoor air quality. I hope it's helpful to other homeowners and to home performance professionals.

Managing Indoor Air Quality

November 19, 2018

We learned during our first winter in our passive house that some smoke particles enter our house through the ventilation system. The smoke particles are so small that the filter doesn't catch all of it. For the last five years, our indoor air quality management routine had been unplugging our Zehnder ComfoAir 350 heat recovery ventilator (HRV) when we smelled smoke inside the house. In the last couple of weeks, we had to refine our seasonal practice because the outdoor air quality had been poor due to large fires in California.

Here's what we are doing at Midori Haus to manage our indoor air quality:

1. External air quality check. We look at the real time air quality index to see what our air quality index number is. If it’s good (green 1-50) then we leave on our heat recovery ventilator (HRV) and operate it as normal. Our normal operation is HRV fan set on medium speed and boosting up to high when we’re cooking in the kitchen. If the air quality is unhealthy (151 -200) or worse, we unplug our HRV. If the air quality is moderate (51-100) we stick our nose outdoor and sniff the air to decide whether to unplug our HRV or not. Just like temperature, there are micro variations of air quality within a given city. For example, last night we noticed and felt the air quality on the east side of out city to be much worse than on the west side. 

2. Check for major fires and wind direction. We look at the California statewide fire map to see what fires are burning nearby. Depending on the size and number of the fires, we may be affected by fires burning over 100 miles away. The wind pattern makes a difference, so we look at the weather data to find out the wind direction. The 10-day forecast section is useful because it will show the change in forecasted wind pattern. With may fires burning north and east of us, winds blowing from south and west bring us relief, especially since those directions are over the ocean.

3. Check air quality levels inside the house. We look at the data from our FooBot. This is a relatively inexpensive air quality monitor for homes. We have it placed in the kitchen near the HRV supply vent. The device glows orange when air quality is bad and glows blue when it’s good. I can see the data and history on the FooBot app on my iPhone. This screen shot shows the state of our indoor air quality after leaving the HRV turned off overnight. The composite score is 53 (a score based on some algorithm) and the breakdown of the air quality components are: Fine particles (4 is great), Volatile compounds (592 is poor), and Carbon dioxide (2000 is poor). We've noticed that Volatile compounds level spikes up when we cook. We have a recirculating venthood in our kitchen, so we rely on the HRV to evacuate the cooking smells. The only way to rapidly clear the air in the kitchen is to open the windows, but we don't want to do that when the outdoor air quality is bad. When we turn off the HRV for an extended period of time, Carbon Dioxide level builds up, like on this screenshot. At these times we turn on the HRV for a short while to flush out the VOC and CO2. During this time the particle count goes up, but we let the air purifier handle that.

4. Run an air purifier. Couple of years ago, Kurt did some research and bought a Plasmacluster Ion technology air purifier from Sharp. Most of the time it sits in his office at work, but recently he’s been hauling this back home in the evening and weekends. This cleans the air and we can feel it. We have recent experience where this device changed our panic to calm. On the morning of Saturday November 10 our house stank of skunk in addition to the smoke. Our neighbor’s dog got sprayed in the middle of the night and HRV sucked in the skunk smell in addition to the smoke. The smoke and skunk particles are so small that they get through despite the layers of filters we have. We were about to host an open house and tour for the International Passive House Days event and we were worried about the indoor air quality. We ran the air purifier for 10 - 30 minutes in each room and it cleared up nicely.

5. House plants in place to clean the air. We have house plants in every room. Plants provide oxygen and absorb carbon dioxide. Several years ago, Kurt bought a lot of peace lily plants after learning that the plant removes chemicals such as benzene and formaldehyde. These plants also help with the humidity. This post from Tips Bulletin has photos and descriptions of the different plants. 

We enjoy living in Midori Haus built to the Passive House (Passivhaus) standard. The tightly sealed enclosure, about 10 times tighter than conventionally built houses, keeps random air from coming in from random places. The heat recovery ventilator provides us with continuous filtered fresh air. Only during these extended bad air quality days do we need to pay special attention to our ventilation system to keep our indoor air clean. Our next experiment will be to install the Zehnder ComfoWell F9 filter (yellow filter that has MERV 15 rating) at the air intake, next to the charcoal filter. If it arrives before the outdoor air clears up, we’ll be able to measure the result of this new filter.

Celebration at Midori Haus: Millionth Square Meter of Passive House

February 1, 2015
Bjorn Kierluf presenting Millionth Square Meter of Passive House Award – photo by Claire Darling 

Date:  February 20, 2015

Time:  3:00 pm
Place:  Midori Haus 
Special Guests:  Bjorn Kierulf, Andrew Michler, Mayor Don Lane, Leslie Villegas (Senator Bill Monning’s staff)

In December 2014 Midori Haus received the official certificate for Passive House Certification from Passivhaus Institut in Germany, marking the milestone of millionth square meter of Passive House around the world.  See the international press release here.

What Is Passive House?

Passive House is a performance-based energy standard in construction. Results from buildings  constructed using the Passive House approach show 80% ~ 90% less energy is used to keep it comfortable.  This voluntary standard is internationally recognized and applies to all types of buildings, not just single family homes.

Why Is this Significant?

It’s a glimpse into the future of housing.  Midori Haus demonstrates that a 93-year old house can have extraordinary energy performance (80% reduction in energy compared to pre-remodel, without applying solar electric panels) and still retain the charm of the original Craftsman architecture.  Energy bills from PGE show that significant reduction of home energy use is possible for all seasons of the year.  Occupants enjoy comfortable temperature and good indoor air quality for the life of the building.  Building owners can do this today by following the Passive House Standard, which has over 20 year track record for reducing energy usage in a buildings.  

In his inaugural speech on January 5, 2015, California Governor, Jerry Brown unveiled ambitious energy goals:

“…we are well on our way to meeting our AB 32 goal of reducing carbon pollution and limiting the emissions of heat-trapping gases to 431 million tons by 2020. But now, it is time to establish our next set of objectives for 2030 and beyond.Toward that end, I propose three ambitious goals to be accomplished within the next 15 years:Increase from one-third to 50 percent our electricity derived from renewable sources;Reduce today’s petroleum use in cars and trucks by up to 50 percent;Double the efficiency of existing buildings and make heating fuels cleaner.”

Midori Haus shows that Passive House Standard easily lead the path towards the Governor’s goal of doubling the efficiency of existing buildings.

About Midori Haus

Originally built in 1922, the 3-bedroom, 2-bathroom single story house was remodeled in 2012 to the Passive House Standard.  The house retained the original foundation, floor, framing, porch, built-in furniture, as well as the interior trims and accents.  Utility bills from PG&E showed that the energy consumption did indeed drop by 80%.

Midori Haus – photo by Kurt Hurley

Design and Passive House Services:  Graham Irwin, Essential Habitat
Construction:  Taylor Darling, Santa Cruz Green Builders

Please refer to the following post for details on energy and water.
Energy Usage:  How Much Energy Did We Use In Our First Year?
Water Usage:  Water Efficiency Features

Contact:  [email protected]

Don Lane, Mayor of City of Santa Cruz, shares his observation of Midori Haus transformation – photo by Bronwyn Barry

Leslie Villegas from Senator Bill Monning’s office presenting Certificate of Recognition from California Senate
– photo by Bronwyn Barry
Taylor Darling, General Contractor, and Graham Irwin, Architect and Passive House Consultant – photo by Claire Darling

Midori Haus Team:  Taylor Darling, Graham Irwin, Tom Nedelsky, Pat Splitt, Chie Kawahara, Kurt Hurley
– photo by Bronwyn Barry

Keeping Cool During Heat Wave

We continue to be very happy with our Passive House.

Last week we had a bit of heat wave here.  It was unusual for Santa Cruz to have 3 consecutive days of temperatures in the mid to high nineties.  The chart below show the daily high and low temperatures (in Fahrenheit) in our area.  The Weather Cat weather station is located just 2 miles away from Midori Haus and is in a similar residential area so it provides good representative historical weather data for us.

What was really unusual about the heat wave last week was that Santa Cruz was about 10 degrees warmer than San Jose.  Normally it’s the opposite.  Have a look at this map below.  Even if Santa Cruz is south of San Jose the cool ocean temperature keeps the area mild and comfortable.  So I was surprised on Thursday last week when we drove back from Berkeley to see the temperature sensor on my car showing 96 degrees in Santa Cruz when it was only 85 degrees in San Jose. 

When we got home and stepped into the house it felt comfortable.  And we have no air conditioning.  Because of the super insulation and air tightness of the house the temperature inside the house stayed in the mid seventies during the entire time.  Here is an example of the temperature reading inside the house showing 23-28 degrees cooler than the outside.

Plotting the periodic temperature readings on this graph you’ll notice that the internal temperature stays in a narrow band while the external temperature swings wildly.

While passive house dramatically retards the heat transfer from the outside to inside (during summer) and from the inside to the outside (during winter) it does take a little bit of conscious action by the homeowner to optimize the comfort.  Let me show you what I mean.

First is shading.  Our deck that extends to the back yard faces south.  This is great in the winter because the 2 rooms facing south receive lots of good solar heat gain when it’s cold and the sun angle is low.  During the summer we want to keep the sun out.  So on Wednesday evening Kurt took out the canvas shade cloth and installed them over the arbor.  Originally we had intended to grow some plants to provide natural shading, perhaps grapes or kiwi.  But we chose not to go down that path because the shade cloth provides us with more flexibility.  After the first summer we decided to keep these shade cloth as a permanent seasonal solution rather than rely on plants because it’s easier to maintain.  Here’s a picture of that.

 Another part of the shading is inside the house.  We have these roller shades installed over the windows.  The ones on the south side of the house are all made of light-blocking thicker material we got from Advanced Blind & Shades,  and they are manufactured locally.

Then there is the setting on the heat recovery ventilator (HRV).  To minimize bringing in excess heat during the heat wave we set the control on the Zehnder ComfoAir 350 HRV to “A” during the day to reduce the ventilation flow down to 23.5 cfm from the normal 95 cfm at “2” setting.

The Zehnder ComfoAir 350, as with other heat recovery ventilators, has the ability to perform passive night time cooling in climates where hot daytime summer temperatures are followed by cool evening temperatures. These are climates in which one would normally open the windows at night. 
Using the HRV “Summer Bypass Mode” allows all the benefit of night time cooling with the windows the added benefit of retaining the filtration of air introduced into the home interior. It allows for a cooling to a precise user selected set point and then resumes its temporarily defeated heat exchange function.

Finally, we open the windows and let the cool air in during early morning.  As you’ve seen from the daily low temperature in from the Weather Cat table above it gets nice and cool overnight.  Typically in the mid to high fifties even during the heat wave.  This really helps to reset the internal temperature before the day heats up again.

By the way, this night or early morning cooling works because the ocean temperature is pretty constant and cool throughout the year.  The table below is the average ocean water temperature from NOAA.  You can see from the table that the water temperature just a mile away from our house is abut 56 degrees Fahrenheit, plus or minus 3 degrees.  Once the sun goes down the cool ocean water cools the air so the overnight temperature is consistently cool.  That’s why homes in Santa Cruz don’t have air conditioning.

Because we don’t have air conditioning we don’t use extra electricity during hot weather.  Our electricity usage continues to stay pretty low during the heat wave of May 13-15, 2014.  Below is the screen shot from PG&E, our local utility, showing our electricity usage for the current month. 

We are happy to be comfortable in our Passive House that uses very little energy.

How Much Energy Did We Use In Our First Year?

About one year ago I cut off 30-inches of my hair
and donated the half-pound of hair to Locks of Love, an
organization that makes wigs for children.  I’ve done this a few times
before and it makes me feel good.  In the past friends would often ask me,
“How’s your house project coming along?” and at times it seemed to go
on forever.  So at one point I started telling everyone, “You’ll know
when it’s done because I’ll cut off my hair and donate them.  If you see
me with short hair that means the house is done!”  So I was quite
happy when I had this photo taken because it meant the house was done and I
didn’t need the extra insulation to keep me warm.
Now that we’ve been living in Midori Haus for one
year it’s time we share our energy data for the first year of occupancy.
 You might recall from my previous post where we compared our energy
data for the first 8 months in Midori Haus with the energy data from the
slightly smaller condo we used to live in.  We were pleased with the
comparison of spring-summer data where our total energy use at Midori Haus
proved to be much lower than the smaller condo.  Now that we have the
energy data for the winter season it’s even better.   Let me show you some
graphs.

If you are a PG&E customer, the above graphs
will be familiar to you.  You can log into your account at pge.com and
select the “My Usage” tab to track, compare, and monitor your energy
usage.  They do a nice job of comparing your energy usage with similar
homes in the area.  Similar homes in the context of Midori Haus is 100
homes with similar square footage (1560 in our case) within half-mile radius
that are heated by natural gas.  At Midori Haus we let the sun do the
warming most of the time but when the sun is not shining the gas boiler
provides make-up heat for the hot water tank and the hot water warms the house.
 Since there is not a category for “mostly sun-heated house” we
technically fall into the category of “heated by natural gas.”

In this past year (March 1, 2013 through February
28, 2014) we used a lot less energy than similar homes.  The total energy
use at Midori Haus was 4,334 kWh
compared to 19,596 kWh for similar homes.  Our Midori Haus used 2,869 kWh
of electricity and a scant 50 therms (this is equivalent to 1,465 kWh) of
natural gas while similar homes used 5,118 kWh of electricity and 494 therms
(this is equivalent to 14,478 kWh) of natural gas.  To put it in another
way, Midori Haus used only 22% of the total energy used by similar homes in the
past year. 

By the way, we were comfortable inside and we do
not have PV (solar electric) to offset our electricity usage.  We plan to
do so in the future but it was important for us to start from the most
efficient house before we put in PV.
This next graph is very validating.  We’re
fortunate to have copies of the energy bills from the prior owner of the house.
 The seller was friendly and ordered PG&E to send copies of the past
energy bill to us for the years 200 and 2006.  Back then there were 3 elderly
occupants in the house and they used gas furnace to heat the house and perhaps some electric space heating too.  Their energy bill from March
2005 through February 2006 is a good basis of comparison with our first year of
post-retrofit occupancy at Midori Haus because many things about the house is
the same:  same square footage, same foundation, mostly same framing, same
floor, same roof, and we kept the original built-in-furniture (dining room
buffet) in place.  So the reduction in energy use that you see below represents
the performance of the house before (without any insulation or air sealing) and
after (super-insulation, extreme airtightness, minimizing thermal bridges, heat
recovery ventilator, low energy lighting, and low energy appliances).  

The prior occupant used 21,928 kWh of energy in one
year.  Midori Haus used 4,334 kWh of energy in one year.  That is
80% reduction in energy use for the same house!
 And Midori Haus stays
in a comfortable temperature range year round with good indoor air quality.
 Passive House works!

Digging further into gas usage I wanted to see if
there is a correlation between rain and gas usage.  So I overlaid the our
daily natural gas usage with rainfall.  It’s a bit challenging to see the
details but you’ll notice that the when there is rain (blue column) the natural
gas (red column) follows close by.  This confirms that gas boiler turns on
if the sun is not shining.  The little blips of gas you see in the summer
months represents outdoor barbecue use.  We have natural gas plumbed to
the barbecue on the deck.
The source of rain data is from a local weather
station that I found on the weather underground site.  The Weather Cat station
is located just 2 miles away from Midori Haus so it’s a good representative of
the outdoor condition for the past year.  Below is a graph of the daily
high and low temperature.  What you will see below is that there is always
about 10-30 degrees Fahrenheit temperature difference between the daily high
and daily low.  Because of this diurnal swing in the temperature we don’t
need to have air conditioning during the summer because the house will cool off
at night if we simply open the windows for an hour or so.  

I now present to you a simple conclusion:  Passive house works.  Up until now we’ve been telling everyone, “Once we have a house built to Passivhaus standard we will use 80% less
energy than similar homes.”  Now we can actually show the data where
we have used 80% less energy than similar homes.  Don’t you want your home to be
passive house too?  :)

First Interim Blower Door Test A Success!

Good news!  The first interim blower door test passed the passive house criteria of 0.6 ACH at 50 Pascals!

This was very happy surprise when we stopped by the job site on Wednesday, 8/1/2012, after returning from a long vacation.  Riding our bikes into the fenced area we saw that the “blower door” (the red plastic lining fitted into the door frame with a large fan hugged by the elastic band on the plastic sheet) was placed in the front door.  Just as we were saying, “Hmm… They’re doing the blower door test today, I don’t think we can get in,” we saw the blower door being dismantled by our air sealing consultant, Terry Nordbye.  He was very happy and pleased to tell us that the house passed the blower door test.  Yeah!

Then we saw Taylor Darling of Santa Cruz Green Builders, our general contractor, walking out of the house with a big smile on his face and showed us this picture:

 
This means that the house, at this mid-construction stage, has met one of the most difficult criteria of passive house certification, air tightness test of 0.6 ACH50 maximum.  Our approach to air sealing is to do few interim blower door test during construction rather than wait until the very end so that air tightness is ensured along the way.  You may ask, what does 0.6 ACH50 maximum mean?  Well, ACH stands for Air Change per Hour.  The target of 0.6 ACH means 60% of the air volume in the house exchanging with the exterior of the house (leaking) each hour.  So, for our house with 1,569 square foot of interior space and 9-feet ceiling, the total volume of air within the house is 14,121 cubic feet.  60% of that is 8,472.6

ft3, which is the maximum allowable air leakage per hour at 50 Pascals (equivalent to having 20 miles per hour wind blowing outside of the house).  Now let’s convert the per hour figure to per minute figure to get to a familiar term of CFM (cubic feet per minute) by dividing by 60 (1 hour = 60 minutes).  This gives us a target of 141 CFM.  As you can see from the above picture (135 CFM at 52.2 Pascals) Taylor and his crew managed to exceed the air tightness criteria!  Excellent job, guys!

Taylor said that in the morning the very first blower door test result came in at 0.96ACH and they knew they knew their work for the day would be a quest for air leaks and patching them with foam and tape.  Fortunately it turned out to be only few large leaks rather than lots of tiny leaks.  One was the drain in the hallway bathtub where it didn’t yet have the p-trap and water in place.  Another was a set of penetration made for solar thermal plumbing.  The third was a penetration in the top plate that wasn’t visible from the bottom that leaked air into the space between two beams in the ceiling.  Here are some photos from Taylor on the examples of air sealing:

Solar thermal plumbing

Sealing around the windows

Foam sealing at the perimeter foundation

EPS foam board under the floor insulation in the crawlspace

Taylor and his crew, in addition to being good builders are air sealing rock stars.  This cannot be emphasized enough because they’ve managed to make this 90-year old house VERY airtight.  I’ve often heard that an average new construction today is about 5~6ACH.  What Taylor and his crew managed to do was to get this old house to be 10 times tighter than an average new construction.  It’s much harder to get to this level of air tightness with a retrofit because we’ve reused many of the existing structure (foundation, framing, roof, floor) from 90 years ago and therefore less control compared to a new construction.  You may also remember that the baseline blower door test for this house was 22 ACH.  We kept the vented attic and vented crawlspace so the air sealing was done at the ceiling and the foam board below the floor joist. 

Advice and help from our air sealing consultant, Terry Nordbye, was very helpful.  At one point during our visit David asked Taylor and Terry about which smoke pens belonged to whom.  After they sorted out their tools I asked Taylor, “So how did those smoke pens work in detecting leaks?”  His reply was, “We didn’t use the smoke pens.  We just listened.”  Apparently they boosted up the blower door fan to 180 Pascals and at that pressure they could hear the air leaks quite clearly.  One thing that leaked air more than expected was the window hardware.  We have lovely triple pane tilt-turn windows from Cascadia and the hardware on the windows leaked air quite a bit.

You may wonder with such air tightness of the house envelope what the indoor air quality will be like.  That will be another post on Heat Recovery Ventilator.

Midorihaus Passive House Windows

It’s important readers! High performance windows tuned to the climate and the compass orientations of the building envelope area are a critical part of the Passive House architectural approach. In our case the glazing area comprises [290ft2/ 1700ft2] or about 17% of the total wall area. The holy grail of window thermal performance is R factor, which is a measure of heat resistance related to the heat transfer per unit area per degree temperature difference from interior and exterior. In the US it has units of (ft²·°F·h)/Btu and is known as R-value. In the rest of the world, window performance is quantified in metric units by a measure of thermal transfer efficiency known as U-factor which is inversely proportional to R-value and whose units are W/(m²·°K). You can see the impact of windows’ thermal performance (R-value) on the overall wall assembly as a function of % glazing area from this graph:
The process of choosing our Passive House windows was quite involved. We were not only trying to achieve the best cost-performance from the window itself but were also wishing to improve the Bungalow aesthetic of our home by adding simulated divided lites (SDLs) known in the past as “muntins.” The original 1920’s architect employed single pane windows throughout the house without muntins. Divided lites are however a key stylistic hallmark of the Bungalow. The opportunity to add this important Bungalow stylistic feature made removing the old single pane lead crystal less regrettable.
Throughout our project we wanted to source materials as locally as possible. However the very best performing windows are European. This also means they have a huge embedded energy resulting from the considerably long shipping distance. High quality European triple glazed windows are generally fabricated from timber sustainably forested in the EU. Wood windows may have as little as 1/6 the embodied energy compared to fiberglass windows and 1/10 the embodied energy compared to vinyl windows. However even with this high performance their total life cycle back time would be largely compromised in the short term because of the embodied freight energy.
Lower cost domestic vinyl windows not only have very high embodied energy but also have significant environmental impacts on air quality (dioxins) during manufacture. Other American windows such as Marvin (wood) or Serious Windows (fiberglass) either offered lower thermal performance or a more limited range of coating options for tuning the glazing to the installed compass orientation to maximize passive solar heat gains for our project.
To complicate matters further there is a significant difference in window performance testing and verification between the continents. European windows are rigorously modeled for performance. However in Europe a physical example of the window is not actually tested by a 3rd party for performance verification as in United States via the National Fenestration Rating Council (NFRC) certification. One cannot understate the importance of physical verification of modeled performance.
The graph below (ZehnderUSA) shows the overall cost efficacy of the subcomponents of Passive House features. The Specific heat consumption numbers shows that, after building orientation, window performance constitutes the largest chunk of energy savings for a building. The cost efficacy units in blue are FR/kWh/a or (Swiss Francs per kWh per annum) savings and show that investing in the best possible windows is a no brainer from the perspective of energy efficiency payback.
We also see that after the investment in high performance windows, increasing the insulation of the exterior shell and employing a heat recovery ventilator (HRV) or energy recovery ventilator (ERV) are the next wisest dollars spent.
Yes, investing in high performance windows is a good investment provided they can provide a lasting energy savings over less expensive but lower performing windows. However the coastal climate of Santa Cruz involves wide swings in outdoor relative humidity levels, precipitation, drizzling fog, and extended intense direct sun & UV due to generally high ambient air quality. This is a stress factor for wood window frame materials and necessitates more frequent resurfacing/repainting even though wood frames are the most sustainable material for window frame fabrication from the perspective of embodied energy. Termites need also be considered as a risk factor with wooden windows.
This is a graph from the Canadian manufacture of pigmented fiberglass windows (Cascadia) we ultimately chose for the project. It is vendor-formatted data you have to take it with a grain of salt but I believe is in general faithful to the facts. It compares many performance attributes of the four different windows frame material types commonly available.
So why did we choose this vendor Cascadia over the rest? This can be seen from the graph below which compares cost and various performance criteria for several vendors:
Simply put, energy efficient buildings minimize reliance on artificial lighting. To achieve this they maximize the amount of natural light admitted into the building interior through their windows. As a result energy efficient buildings enjoy high natural lighting efficacy. Energy efficient buildings also need to retain interior heat very efficiently at night and during cold seasons. For windows to accomplish all this at once requires special optical coatings which transmit in the light we see (visible light) while controlling or reflecting invisible heat energy (short wave infra-red) from the inside out and from the outside in. Different vendors offer different solutions but generally a thin layer of metallic silver is deposited onto the inner surfaces of the outmost glass and the cavity is filled with an inert gas such as Argon to prevent future tarnishing of the silver. One exception is Serious Windows whose products offer good thermal performance but rely on an inner polymer film to control Solar Heat Gain Coefficient (SHGC). SHGC is the measure of the amount of short wave infrared that passes through the window from the exterior. If the SHGC is too high and there is no effective roof overhang or shading this can contribute to high summertime HVAC loads, especially in climates with a high CDD (Cooling Degree Day) load. You learn more about HDD and CDD here: http://en.wikipedia.org/wiki/Heating_degree_day. Maps for the US are here: http://en.wikipedia.org/wiki/File:United_States_Heating_Degree_Day_map,_1961-1990.jpg and here: http://en.wikipedia.org/wiki/File:United_States_Cooling_Degree_Day_map,_1961-1990.jpg.
In the case of the Serious Windows approach, the windows were dimmer that other vendors with comparable SHGC. In quantitative terms this means they are lower in natural lighting efficacy due to lower Visible Transmittance or VT, which is the ratio of the light ultimately getting through the window expressed as a fraction of the total visible light reaching the exterior of the window. Serious Windows uses internal, non-ceramic thin films between the outer glass panes, which are also absorptive in the ultra-violet band. Ultra violet light chemically alters many hydrocarbon-based materials over time. This approach may not prove as durable as triple glazed with all ceramic glass although, however in all fairness, Serious Materials offers a life warranty on their windows. The Marvin triple glazed windows are not as well performing as either the Cascadia or the other European triple glazed offerings. The Cascadia windows offer a higher Solar Heat Gain Coefficient, higher VT (more light gets indoors), and somewhat better thermal performance (lower U value) than the Marvin Windows but to not quite attain performance the European vendors. It should be mentioned the Marvin Windows had some nice features such as optional built-in bug screens and SDLs that looked very nice in the show room.
The European windows we saw on tours were, as expected, beautiful and extremely well built. Many offer an aluminum cladding over the wood frames. The Sorpetaler windows were quite impressive as seen in two other Bay Area Passive Houses. However, all of the European windows would have been burdened with very high embedded shipping energy. Since we also considered global warming potential when selecting our insulation materials we thought being consistent with the windows too would serve the overall desired project outcomes. The Cascadia windows were the best overall balance of desired outcomes at the time of our project. However this will likely change and hopefully more domestic alternatives for Passive House projects will become available domestically. The American made wooden H and H windows were very cost competitive to Cascadia. From a sustainability perspective H and H seemed an ideal choice with lower transport embodied energy (made in the US) and lower embodied manufacturing energy (wooden frames). But at the time of our project H and H had no NFRC certification. That was too high of a risk to assume since we would only learn of any shortcomings in air sealing after installation. A final vendor comment..the Inline window rep kept trying to steer us away form triple pane and towards a high performance double pane option.
This brings us to a final discussion point. Why triple paned in the comparably mild climate of Santa Cruz CA? Three reasons (1) enhanced street noise attenuation (2) enhanced winter comfort due to higher indoor glass surface temperature (3) best bang for the buck in energy savings. The fact of the matter is that once you are working with a vendor who can satisfy the air tightness requirement and window frame R values needed for a Passive House you are in a price range where much of what you are paying is for the overall build quality and engineering. The marginal savings of a few thousand dollars do ‘downgrade’ to double pane glass didn’t seem with it when considering the ancillary comfort benefits.
Getting your Passive House windows right will be an in depth exercise for the homeowners and designers requiring tremendous attention to detail and patience in working with the vendors. It is critical to ensure that the correct coatings are incorporated in each window to ensure that window’s performance relative to its compass orientation NSEW. Customer service is sometimes lacking. Be fore-warned! Our issues involved trying to avoid the ‘grilles between glass’ or GBG with our SDLs. We were unable to get a different color SDL adhesive (which adheres the SDL bar to the exterior glass surfaces). This meant using aluminum bars between the #2 and #3 glass surface to avoid the awkward visual gap when looking though the windows from an angle. The Cascadia GBG bars are thermally broken as they intercept the divider at the edge of the glass. We have been told the thermal performance as modeled by the glass unit manufacture (Cardinal USA) is not appreciably affected. We have yet to receive the exact modeling for our project..story continued.

Passive House Tours

Organized home tours are great way to get ideas, meet interesting people and learn about the house.  Architecture and landscaping gives a certain “feel” to the house.  Finding out about material choices give an insight to the owner’s values.  Learning about various systems used, like solar thermal, photovoltaic, energy management, rainwater harvesting and gray water systems has been interesting and often inspiring.  Years ago, when we’ve attended “Solar Homes Tour,” or “Green Homes Tour,” or “Open Architecture Tour,” we would dream about doing a green house project of our own someday.  After visiting a home we would note, “How we felt,” at the house and discuss what we liked and disliked about the house.  These tours were planting seeds in our mind.  After going to so many of these we found that our tastes and preferences were similar so when we decided to do our Midorihaus Project we simply germinated the seeds that were planted through the tours.

This year we’ve been to several “Passive House Tours” in the Bay Area.  Unlike the one day organized tours of several houses where people come and go all throughout the day, these Passive House Tours are compact and provide the visitors with an in depth view of the project.  At each of these sites there is a formal presentation with a team of architect, builder, passive house consultant and sometimes the owner that presented the highlights of the project.  They’re all quite passionate about building energy efficient homes and are generous with their time.  We’ve learned so much from talking to different people at these tours!

This is a brief list of passive house tours we’ve been to this year (2011).

March 27 – Cottle Zero Energy Home in San Jose, designed and built by One Sky Homes.

May 13 – Green Gulch Farm at San Francisco Zen Center at Muir Beach.

June 1 – Menlo Passive Project in Menlo Park by Clarum Homes.

Coming up….
Green Home Project in Palo Alto that is going live on June 4.  This site will host the next monthly meeting for Passive House California on June 26.

Of course, sometime in 2012, we will host a tour of our Midorihaus Project in Santa Cruz.

Passive House Example Up the Coast

Here is a brilliant video that show many details of the passive house construction.  It’s an affordable housing project near Point Reyes, about 100 miles up the coast from us.  Our project is a little different because it’s a remodel and not a new construction.  Still the passive house approach to insulation, airtight building, HRV and windows are all relevant for us.

Grab a cup of tea and enjoy this 30 minute video.

>